Fig. 4
Download original image
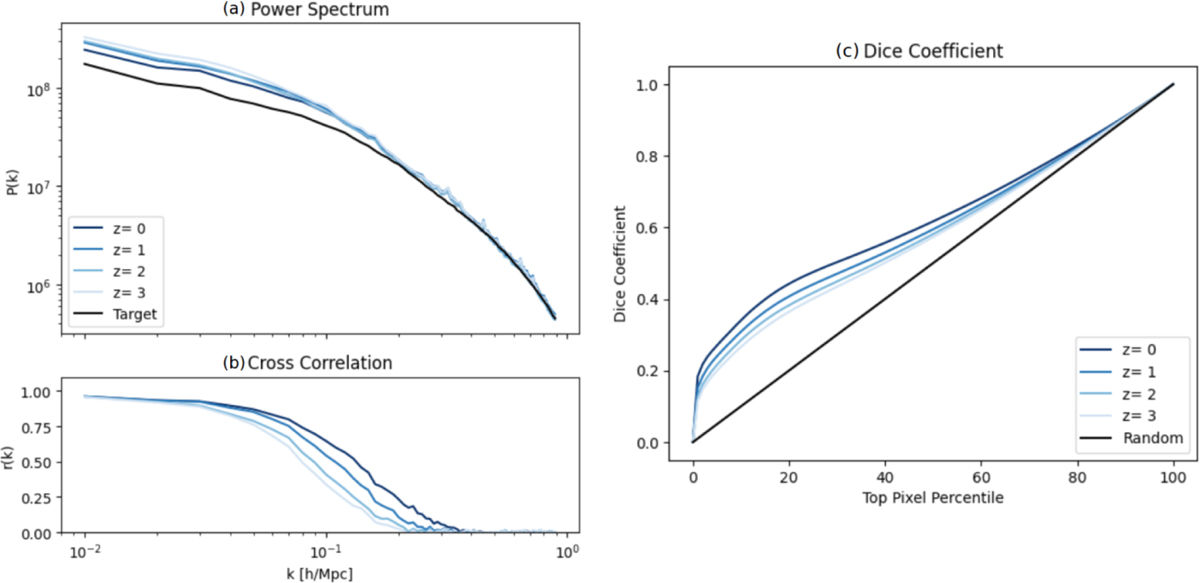
Spectra, cross-correlation coefficient and Dice coefficient for baseline timewarper on 2D data. (a) Average power spectra from predictions from input redshifts z = 3 → 0 (blue scale), and average target spectrum at z = 0 (black). (b) Corresponding average cross-correlation coefficient between prediction and target over the same redshift range. (c) Average Dice coefficient between prediction and target (same blue color scale as in a and b).
Current usage metrics show cumulative count of Article Views (full-text article views including HTML views, PDF and ePub downloads, according to the available data) and Abstracts Views on Vision4Press platform.
Data correspond to usage on the plateform after 2015. The current usage metrics is available 48-96 hours after online publication and is updated daily on week days.
Initial download of the metrics may take a while.