Fig. 1.
Download original image
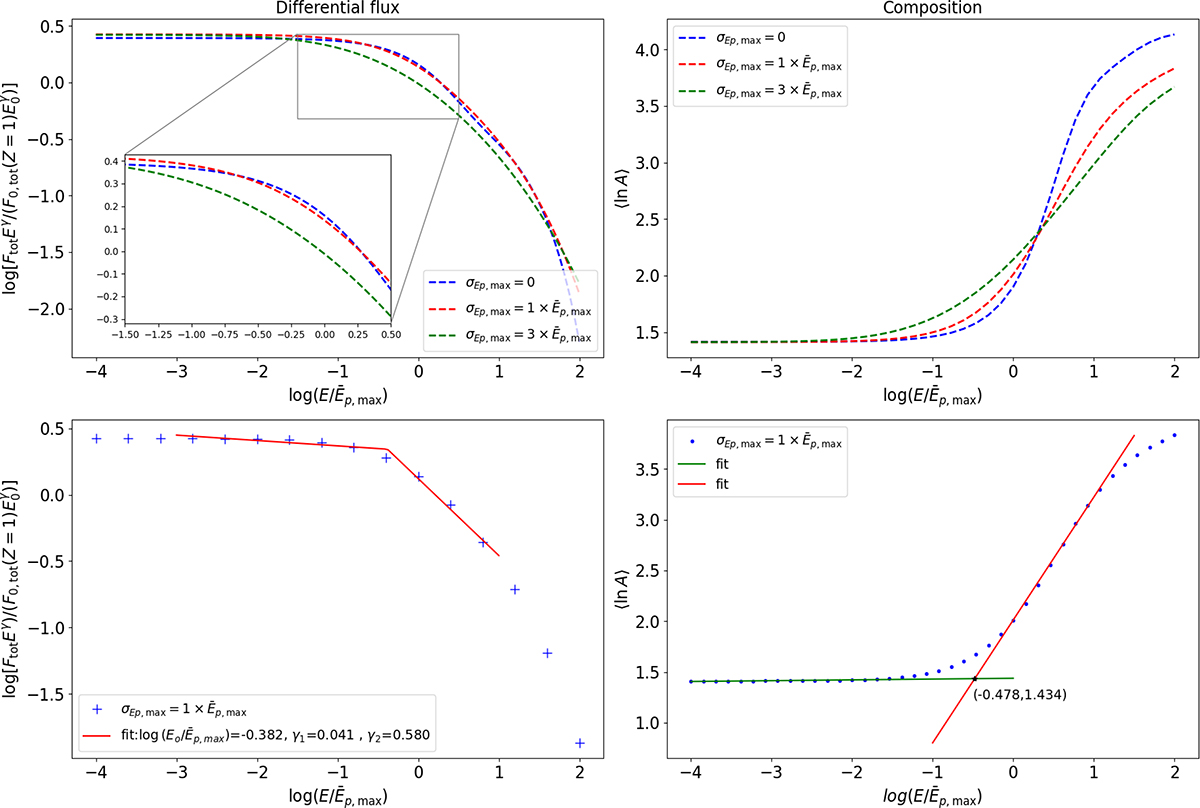
All-particle flux and composition spectra in the case of a lognormal p(Ep, max). Upper left panel: All-particle flux spectrum flattened by Eγ. Upper right panel: composition spectrum. Lower left panel: Broken power-law fit around the knee for the flux spectrum. The crosses correspond to mock observations obtained from our model. The solid line shows the fit of Eq. (12). Lower right panel: Low- and high-energy asymptotic logarithmic fits to the composition spectrum (solid green and red lines, respectively). The points again correspond to mock data obtained from our model. The composition break energy is given by the intersection of the two lines (black star).
Current usage metrics show cumulative count of Article Views (full-text article views including HTML views, PDF and ePub downloads, according to the available data) and Abstracts Views on Vision4Press platform.
Data correspond to usage on the plateform after 2015. The current usage metrics is available 48-96 hours after online publication and is updated daily on week days.
Initial download of the metrics may take a while.