| Issue |
A&A
Volume 706, February 2026
|
|
|---|---|---|
| Article Number | A101 | |
| Number of page(s) | 8 | |
| Section | Astrophysical processes | |
| DOI | https://doi.org/10.1051/0004-6361/202450483 | |
| Published online | 02 February 2026 | |
What can cosmic-ray knees reveal about source populations?
1
University of Crete, Department of Physics & Institute of Theoretical & Computational Physics 70013 Herakleio, Greece
2
Institute of Astrophysics, Foundation for Research and Technology-Hellas 71110 Heraklion Crete, Greece
★ Corresponding authors: This email address is being protected from spambots. You need JavaScript enabled to view it.
; This email address is being protected from spambots. You need JavaScript enabled to view it.
Received:
23
April
2024
Accepted:
26
October
2025
Abstract
Context. Breaks in the cosmic-ray (CR) flux spectrum encode information on the properties of CR accelerator populations producing the observed flux. Spectral steepenings, known as knees, are generally accompanied by a transition to a higher-mass composition.
Aims. We seek generic features of CR source populations that are robustly enough imprinted on knee observables to be discernible even in the presence of significant uncertainties in CR data. We explore how the diversity among population members imprints on the knee phenomenology under the assumption that a knee arises from a fixed-rigidity cutoff in the source spectrum. Our scope is explicitly exclusionary: We did not fit specific datasets, but determined which observed spectral features are incompatible with a single-population fixed-rigidity cutoff picture, which would indicate additional physics.
Methods. We used a simple theoretical model for a population of CR accelerators. Each member of the population stochastically accelerated CR to a power-law spectrum up to a cutoff rigidity that resulted from source-confinement requirements. We allowed variance among the members in the cutoff rigidity and in the power-law slope.
Results. We found that (a) the slope step of the flux spectrum is ∼0.5 and decreased weakly with increasing spread in either property, (b) composition always broke first, and (c) the difference between the break energies in composition and flux increased with increasing diversity. These trends are robust under our assumptions. Deviations from them in observed data would indicate more complex physics than encoded in our simple model.
Conclusions. From comparing these trends with observed CR knees, we conclude that (i) the primary knee at ∼4 × 10¹⁵ eV is consistent with a constant-rigidity cutoff according to KASCADE-Grande data processed with post-LHC hadronic models, but not according to other datasets, (ii) the second knee at ∼5 × 10¹⁷ eV conclusively requires more complexity than the cutoff of a single CR source population, (iii) the constant-rigidity source cutoff interpretation of the spectral feature identified by Auger at ∼1019 eV cannot be rejected when the cutoff rigidity and slope in the parent source population are substantial. Interestingly, a significant spread in slope would also result in the spectral curvature before the break, which in turn might contribute to the ankle feature.
Key words: acceleration of particles / astroparticle physics
© The Authors 2026
 Open Access article, published by EDP Sciences, under the terms of the Creative Commons Attribution License (https://creativecommons.org/licenses/by/4.0), which permits unrestricted use, distribution, and reproduction in any medium, provided the original work is properly cited.
This article is published in open access under the Subscribe to Open model. This email address is being protected from spambots. You need JavaScript enabled to view it. to support open access publication.
1. Introduction
The energy spectrum of cosmic radiation is a critical observable for our understanding of the nature of cosmic ray (CR) accelerators. This spectrum can be described as a power law over many orders of magnitude (from ∼109 eV to ∼1020 eV). The spectral power index, however, changes at characteristic energies. This is referred to as knees (when the spectrum steepens) and ankles (when the spectrum flattens).
Knees have now been spectrally resolved in great detail at several different energies in the CR spectrum, ranging from few times 1015 eV to 1019 eV (e.g., Nagano et al. 1984; Cassiday et al. 1990; Fowler et al. 2001; HIRES/Mia Collaboration 2001; Antoni et al. 2005; Abbasi et al. 2005; Amenomori et al. 2008; Aartsen et al. 2013; Aab et al. 2020; Cao et al. 2024). These breaks are typically accompanied by transitions to higher-mass composition at about the same energies as the spectral break (e.g., Chiavassa et al. 2019; Aab et al. 2020). This behavior has led to the qualitative interpretation of the knee phenomenon as a constant-rigidity cutoff (also referred to as Peters cycle; Peters 1961), either in Galactic confinement or in source acceleration/confinement: Particles that are stochastically accelerated by a CR source cannot reach energies beyond the threshold after which magnetic confinement is lost. This effect occurs roughly at the energy where the particle gyroradius in the magnetic field of the source becomes comparable to the size of the source (e.g., Hillas 1984).
A rich literature exists on quantitative models of the various knee-like breaks of the CR spectrum. It ranges from fits of specific datasets with complex phenomenological models to comprehensive physical models, including specific hypotheses on source accelerator physics and source population properties, propagation effects, and simulations of atmospheric air showers to obtain direct observables (e.g., Hillas 1979; Sveshnikova 2003; Hörandel 2004; Lemoine 2005; Kotera & Lemoine 2008; Bijay & Bhadra 2016; Aab et al. 2017; Kimura et al. 2018; Mollerach & Roulet 2019; Guido et al. 2022; Mukhopadhyay et al. 2023; Muzio et al. 2024).
Despite these intensive theoretical and experimental efforts, the exact characteristics, nature, and origin of all observed CR knees is still under debate. One very important factor contributing to this continued uncertainty is that the data are not yet fully converged. High-level observables (i.e., spectra and moments of the log mass-number distribution) can differ between observatories, which use different observational techniques at the same energies (see, e.g., the review of data on the primary knee by Blümer et al. 2009), between different observatories using similar techniques (see, e.g., differences in flux and composition at the highest energies reported by the Pierre Auger Observatory and Telescope Array, Deligny 2020; Yushkov et al. 2019), between events recorded by the same observatory when using different observables (see, e.g., differences in composition at ultrahigh energies derived when using shower depth or shower muon content; e.g., Sanchez-Lucas 2017), and even between identical recorded datasets when processed with different simulations of hadronic interactions (e.g., with pre- versus post-LHC models; Antoni et al. 2005; Chiavassa et al. 2019; or with different hadronic interaction packages of the same generation; Yushkov 2019). As a result, detailed fits to sophisticated source population models may fail or return parameters that appear to be astrophysically contrived (e.g., Aab et al. 2017; Ehlert et al. 2023), not because the models are necessarily inconsistent with the actual source populations, but rather because our data from these source populations might be affected by systematics that are not adequately quantified or accounted for.
The question then arises whether any generic features of cosmic-ray source populations exist that are imprinted onto cosmic-ray observables in a manner that is robust enough and distinct enough to be discernible even in this still-fluid experimental landscape. We aim to answer this question here. Using the simplest possible model for an underlying population of CR accelerators, we seek to build insight on how the diversity between population members might be imprinted on the knee phenomenology under the assumption that a knee is a fixed-rigidity-cutoff phenomenon. This insight is necessary in order to identify any robust features and trends of simple population models and their most straightforward variations. Absence of these features would then constitute evidence of more complex physics of either CR acceleration (complicated astrophysics) or CR interactions at the detection site (unexpected particle physics). Throughout, we therefore use a deliberately minimum model to test falsifiability: When a feature violates the robust trends of this simple picture, the population-effects-only hypothesis can be rejected, even though consistency never proves sufficiency. We refer to this use as an exclusion test (ruling out a single-population fixed-rigidity picture based on the absence of characteristic expected spectral and composition features).
A knee is described phenomenologically by the characteristic energy at which the break occurs in the CR flux spectrum, by the spectral slopes before and after this characteristic energy, and the (generally different) energy at which the accompanying break in CR composition takes place. We investigated whether features of the population of CR sources that cause the knee result in patterns in these observables that are simple and robust enough for them to be recognizable even in the presence of significant systematic uncertainties in the data.
To this end, we set up a simple generic model for a population of CR accelerators with the following properties: (a) For energies well below its rigidity cutoff (equal to the proton cutoff energy, Ep, max), each source contributes to the Galactic CR flux particles with a power-law spectrum with energies of slope γ (encoding the source acceleration properties and losses during propagation). (b) The rigidity cutoff can be described by an exponential suppression of the power-law spectrum. Different nucleus cutoffs at different energies scale as ZEp, max. (c) We allow diversity between members of the CR source population in Ep, max and γ. A knee observed in the summed CR spectrum as a result of this population of sources consists of a break in the spectrum that encodes but is not necessarily equal to Ep, max, and a break in the composition at a similar but not necessarily identical energy. The location in energy of these breaks and the slope difference between and after the knee were modulated by the distribution of γ and Ep, max among the individual members of the population.
We explored the features and trends of this simple model, and in particular, we studied the conditions under which the flux spectrum and composition spectrum break together. When they do not break together, we determined which one breaks first. We also determined the relation of the break energies to Ep, max and examined the effect of the diversity of the population properties, manifesting as a spread in Ep, max and γ, on these questions.
Our model intentionally omitted additional processes (e.g., energy losses and interaction channels at the highest energies, multipopulation transitions, or detailed transport changes) because we aimed to isolate and demonstrate the generic imprint of source-population diversity alone. The result we obtained in this way is a set of robust qualitative trends and their energy ordering; their absence in data is a diagnostic of missing physics in this minimalist picture.
The simplicity of our model is by design: We sought features that are imprinted by these physical phenomena alone, and we therefore attempted to isolate their effect by stripping the model we used down to basics. Our framework was deliberately single-population and omitted multipopulation transitions (e.g. Galactic-to-extragalactic or multiple Galactic components); when these transitions occur, the qualitative trends we derived are intended as exclusion tests of the single-population hypothesis and not as a fit to that regime.
This paper is organized as follows. In Sect. 2 we lie out the formulation of our model and emphasize its free parameters and their effect on the observable flux and composition spectra. In Sect. 3 we explore the behavior of these observables with increasing population diversity. We summarize our conclusions and discuss them in the context of observations of various CR knees in Sect. 4.
2. The model
2.1. Single source
We implemented a fixed-rigidity cutoff tht is characteristic of CR sources relying on magnetic confinement (Hillas 1984; Hörandel 2004). We did this by assuming that the differential flux Fz produced by a single cosmic-ray source as a function of the energy E of primary particles of charge Z has the form
![Mathematical equation: $$ \begin{aligned} F_{z}(E) = F_{0}(Z)\left(\dfrac{E}{E_0}\right)^{-\gamma } \exp \left[ -\dfrac{E}{Z E_{p,\mathrm{max}} }\right], \end{aligned} $$](/articles/aa/full_html/2026/02/aa50483-24/aa50483-24-eq1.gif) (1)
(1)
where Ep, max is the rigidity cutoff, F0(Z) is the flux of a specific species of atomic number Z at some normalization energy E0 ≪ Ep, max, and γ is the low-energy power-law slope. In our model, we assumed that γ is identical for all species in a single source and that it encodes acceleration and propagation physics (including losses and escape). The validity of this approach was established observationally because, for example, the cosmic-ray spectrum sufficiently below the primary knee is well described by a single power law whose slope encodes acceleration and energy-dependent propagation losses and escape. We emphasize, however, that in our context, γ is meant to encode physics at energies immediately below each knee, before the maximum rigidity is reached for any species. While in our plots in later sections we extend the depiction of the spectrum behavior over several orders of magnitude below the knee, we do so solely to improve the visualization of the break feature.
The total flux from a single source at an energy E is the sum of Fz(E) over all primary charges,
 (2)
(2)
We took the relative abundances F0(Z) from Zhao et al. (2015) (see their Table 1, where they present their fit parameters for a power-law like model for every nucleus). While Zhao et al. (2015) fit a different slope γz for different species, we adopted an effective value of γ ≈ 2.66 for all species. Our results are independent of the exact choice for the value of γ, however, because we always plot deviations (differences) of the fit slopes from the underlying source γ. We simulated fluxes for the following individual species: H, He, C, O, Ne, Mg, Si, and Fe. These abundances are observationally motivated for energies below the primary CR knee, but our qualitative conclusions do not depend sensitively on this choice and therefore hold for any source population that accelerates particles with a mixed composition that is roughly comparable to that of Galactic CR, even if the pre-break abundances differ in their details from those we adopted here. To verify that our qualitative conclusions are not contingent on the adopted pre-cutoff composition, we repeated the analysis with abundances tuned to higher energies (KASCADE-Grande; Apel et al. 2013a).
We quantified the resulting composition spectrum by the average of the logarithm of the mass number as a function of energy, ⟨lnA⟩ (E), because this metric is frequently used to summarize CR composition observations. For a single source, this is given by
 (3)
(3)
2.2. Source population
The CR observables on Earth at a given energy are produced by particles that are accelerated by a population of sources with a distribution of sizes, B fields, and other properties. Variations in these physical conditions among population members result in corresponding variations in the source model parameters (see, e.g., Workman et al. 2022; Diesing 2023). In our simple source model, these parameters are F0(Z), γ, and Ep, max. We were interested in any signatures of the diversity in Ep, max and γ that are imprinted on the observables of a knee produced by a constant-rigidity cutoff in the source spectra. To isolate the effects of each of these source properties, we explored the effect of increasing spread in one of Ep, max, γ, while keeping the distribution of the other fixed to a delta function. We also made the simplifying assumption that relative values of  (the relative abundances of the accelerated particles at energies well below the proton cutoff) are identical among different population members, so that the only quantities that may vary between individual CR sources are F0(Z = 1), Ep, max, and γ.
Mathematically, we modeled this picture as follows. At a normalization energy E0 well below the lowest Ep, max encountered in the specific population, the exponential suppression factor in Eq. (1) at E0 is equal to 1 for all sources. The resulting total flux from all population sources at this energy can be calculated as
 (4)
(4)
where the summation is over different population member sources. This equation defines the flux normalization of species Z for the population, FZ, tot, 0.
To calculate the spectrum at higher energies, we introduced the probability distributions pE(Ep, max) and pγ(γ) of the cutoff rigidity and the respective low-energy power-law slope in the population. Formally, pE(Ep, max)dEp, max is the fraction of particles at energy E0 that were accelerated by sources with rigidity cutoffs between Ep, max and Ep, max + dEp, max, and pγ(γ)dγ is the fraction of particles accelerated by sources that if had they caused the entire CR spectrum at low energies, would have produced (after acceleration and propagation) a spectrum that would have been a superposition of power laws with slopes between γ and γ + dγ. Then, the total flux of species Z caused by the entire population was calculated through
 (5)
(5)
The total CR flux caused by all species is
 (6)
(6)
Finally, the composition spectrum caused by the population is given by
 (7)
(7)
2.3. Varying Ep, max
We estimated the effect of a spread in Ep, max among population members by assuming pE(Ep, max) is lognormal,
![Mathematical equation: $$ \begin{aligned} p_E(E_{p,\mathrm{max}}) = \dfrac{1}{E_{p,\mathrm{max}}\sigma \sqrt{2\pi }} \exp \left[ -\dfrac{(\ln E_{p,\mathrm{max}}-\mu )^2}{2\sigma ^2}\right]\,. \end{aligned} $$](/articles/aa/full_html/2026/02/aa50483-24/aa50483-24-eq9.gif) (8)
(8)
The parameters of the distribution μ and σ are related to the mean and the standard deviation of the distribution through
 (9)
(9)
and
![Mathematical equation: $$ \begin{aligned} \sigma ^2 = \ln \left[1+\left(\dfrac{{\sigma _{E p,\mathrm{max}}}}{{\bar{E}_{p,\mathrm{max}}}} \right)^2\right]\,. \end{aligned} $$](/articles/aa/full_html/2026/02/aa50483-24/aa50483-24-eq11.gif) (10)
(10)
The advantage of the lognormal distribution is that Ep, max is positive definite, and as a result, arbitrarily high values of σEp, max can be accommodated. This allowed us to examine asymptotic behaviors for very diverse populations. The distribution pγ remained fixed to a delta function.
2.4. Varying γ
To estimate the effect of a spread in γ, we kept pE(Ep, max) fixed to a delta function, and we implemented a Gaussian pγ(γ), with mean  and spread σγ. In this case, Eq. (5) has an analytic solution,
![Mathematical equation: $$ \begin{aligned} F_{Z, \mathrm{tot}}(E) = F_{z,\mathrm{tot},0} \exp \left[ -\frac{E}{ZE_{p,\mathrm{max}}}\right] \left(\frac{E}{E_0}\right)^{-\bar{\gamma }}\!\!\exp \left[ -\frac{\sigma ^{2}_\gamma }{2}\ln ^2\left( \dfrac{E}{E_0}\right) \right]. \end{aligned} $$](/articles/aa/full_html/2026/02/aa50483-24/aa50483-24-eq13.gif) (11)
(11)
2.5. Observables
Even though the flux suppression of individual CR species is exponential, the fact that the suppression sets in at increasing energy for increasing Z results in a flattening of the knee. This is true for individual sources (Eq. (2)), and more so for a population (Eq. (6)) in which the spread in Ep, max and/or γ results in a smoother break. Observed knees are well fit by broken power laws, and we attempted the same for our model results. In particular, we tested whether a broken power law of the form
 (12)
(12)
accurately described the total flux around the knee. From this fit, we exctracted the observables γ1 (slope before the break), γ2 (slope after the break), and Eb (break energy).
We additionally evaluated a fourth observable, the composition break energy, EA. We did this by (a) fitting the composition spectrum of Eq. (7) for  by a constant (horizontal line) and (b) fitting the composition spectrum by a logarithmic increase (linear increase with log E) for
  . Then, EA is the energy at which the two lines intersect (see lower right panel of Fig. 1).
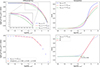 |
Fig. 1. All-particle flux and composition spectra in the case of a lognormal p(Ep, max). Upper left panel: All-particle flux spectrum flattened by Eγ. Upper right panel: composition spectrum. Lower left panel: Broken power-law fit around the knee for the flux spectrum. The crosses correspond to mock observations obtained from our model. The solid line shows the fit of Eq. (12). Lower right panel: Low- and high-energy asymptotic logarithmic fits to the composition spectrum (solid green and red lines, respectively). The points again correspond to mock data obtained from our model. The composition break energy is given by the intersection of the two lines (black star). |
3. Results
We started by examining the trends induced on the observables by a gradually increasing spread in Ep, max among population members. In the upper left panel of Fig. 1 we show the all-particle spectrum (flattened by Eγ) as we evaluated it from Eqs. (5) and (6) and for a lognormal p(Ep, max), for ![Mathematical equation: $ {\sigma_{E p,\mathrm{max}}} \in[0,3{\bar{E}_{p,\mathrm{max}}}] $](/articles/aa/full_html/2026/02/aa50483-24/aa50483-24-eq17.gif) . For broader p(Ep, max), the all-particle spectrum deviates sooner (at lower energies) from its low-energy asymptotic behavior, as a result of the property of the lognormal distribution to peak around values of
. For broader p(Ep, max), the all-particle spectrum deviates sooner (at lower energies) from its low-energy asymptotic behavior, as a result of the property of the lognormal distribution to peak around values of  . At the same time, the spectrum falls less steeply at high energies, owing to the tail of the lognormal toward high Ep, max values.
In the lower left panel of Fig. 1, we show an example of fitting the all-particle flux spectrum around the knee with a broken power law. The case depicted here ws produced by setting σEp, max = Ep, max in the lognormal p(Ep, max). We obtained the break point Eb and the spectral power indices γ1,γ2 through these fits (the observables discussed in the context of Eq. (12)), and we present and discuss them in Figs. 2 and 3 as functions of σEp, max.
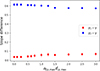 |
Fig. 2. Values of the spectral power indices γ1 and γ2, indicated with red and blue points respectively, as a function of |

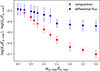 |
Fig. 3. Energies of the composition break (red) and the flux break (blue) in units of |


The upper right panel of Fig. 1 shows the composition spectrum for the same models as in the upper left panel. The break in flux is accompanied by a break in composition. The impact of increasing σEp, max on the composition spectrum is more pronounced than that on the flux spectrum toward lower and higher energies and also in terms of the steepness of the break. To quantify this behavior, we again fit the low- and high-energy trends with logarithmic functions (⟨lnA⟩ linear in log E), as shown in the lower right panel of Fig. 1. The intersection of the two fits defines the composition break energy, EA.
The effect of σEp, max on the observables is shown in Figs. 2 and 3. Figure 2 shows the exponents γ1 and γ2 (slopes before and after the break; red and blue points, respectively), evaluated as the difference from the single-source slope γ. The error budget is completely dominated by systematic uncertainties, which is primarily driven by the choice of points that were included in the fit. The error bars correspond to the difference between including or dropping an additional point at the high-energy tail of the fit (see the lower left panel of Fig. 1).
The difference between the two slopes starts at ∼0.6 for a population comprised of members with identical Ep, max (σEp, max = 0), and decreases slowly as σEp, max increases, reaching ∼0.5 for  . This mild trend is a result of two compounding effects. First, as σEp, max increases, the number of sources with low Ep, max also increases, so that the low-energy branch of the broken power law is also affected (becomes steeper, γ1 increases) as some sources have already started to become suppressed at low energies. Second, a high σEp, max also results in a larger number of sources with high Ep, max. The flux of these sources is not suppressed until higher energies, resulting in a smoother decline of the all-particle spectrum. The high-energy branch of the power law thus becomes shallower (γ2 decreases). The overall conclusion is that a fixed-rigidity cutoff in a CR source population with identical power-law slopes γ and a pre-break composition roughly comparable to that of Galactic CR produces a knee with a slope change in the range of ∼0.5 − 0.6, regardless of spread in Ep, max.
In Fig. 3 we overplot the break energies of the spectrum (Eb, blue points) and of the composition (EA, red points) as a function of the spread in Ep, max. The error bars are again dominated by systematics. For Eb, they were obtained in the same way as the error bars in γ1 and γ2. In the case of EA, they correspond to the difference resulting from retaining or dropping one point toward the break in the rising part of the composition spectrum. For a population with members of identical or very similar Ep, max, the composition and flux spectrum break together, at an energy about half of Ep, max. As σEp, max increases, the composition and the flux spectrum break earlier, but EA decreases faster than Eb, and as a result, the composition always breaks first.
To examine whether the trends we identified depend strongly on our assumed elemental composition, we repeated the analysis using an alternative set of relative abundances derived from Apel et al. (2013a), and we followed exactly the same procedure as described in Section 2. The new versions of Figs. 2 and 3 are presented in Figs. 4 and 5, respectively.
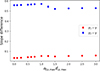 |
Fig. 4. As in Fig. 2, but using the initial CR composition taken from Apel et al. (2013a), which is more appropriate for energies above the knee. |
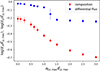 |
Fig. 5. As in Fig. 3, but using the initial CR composition taken from Apel et al. (2013a), which is more appropriate for energies above the knee. |
The qualitative behavior of all observables remained unchanged: The slope step stayed within the same range (∼0.5 − 0.6), and the composition continued to break before the flux. Therefore, our main conclusions are robust with respect to reasonable variations in the assumed source abundances.
We studied the trends in observables that result from a spread in γ among the population members. For these calculations, we kept pE(Ep, max) fixed to a delta function. In Fig. 6 we plot the all-particle spectrum (flattened by  ) as we evaluated it from Eqs. (5) and (6) and for a Gaussian pγ(γ). The different line colors correspond to different values of σγ. the range of σγ we considered is much narrower than the range of σEp, max because a large spread in power-law indices results in significant spectral curvature (see, e.g., the dashed black line in Fig. 6), which is not generally seen in the CR spectrum. Interestingly, small spreads in γ appear to generate diversity in the flux spectrum comparable to that produced by very substantial spreads in Ep, max.
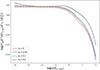 |
Fig. 6. All-particle spectrum flattened by |

We investigated the qualitative direction of the trends seen in the observables with increasing σγ and quantified them, as shown in Figs. 7 and 8. The trend of the sharpness of the break with σγ is shown in Fig. 7. The colors and error bars are the same as in Fig. 2. The slope step again decreased with increasing population spread from about 0.6 for a population with no spread to about 0.45 for σγ = 0.2. This is primarily driven by the shallower post-break slope. Still, the effect is very mild: In a standard fixed-rigidity-cutoff knee, the slope change does not become very different from a 0.5 step even when the underlying accelerator population is significantly spread in its properties.
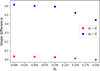 |
Fig. 7. Values of the spectral power indices γ1 and γ2, indicated with red and blue points, respectively, as a function of σγ. |
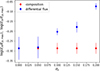 |
Fig. 8. Energies of the composition break (red) and the flux break (in blue) in units of Ep, max as a function of σγ. |
The trends in energy breaks are now different, however, as is shown in Fig. 8. The location of the composition break, EA, is not affected by any spread in γ. The flux spectrum break, Eb, on the other hand, increases with increasing population spread: The more diverse the population in γ, the later the break in the flux spectrum. Importantly, the overall result indicates the same direction as for a spread in Ep, max: The composition always breaks first.
4. Conclusions and discussion
We have used the simplest possible model of a knee induced by a fixed-rigidity CR-source cutoff in order to explore how diversity among the members of the underlying cosmic-ray accelerator population affects the knee phenomenology. In particular, we explored how diversity in (a) the rigidity cutoff Ep, max and (b) in the pre-knee cosmic-ray slope γ (encoding acceleration and loss/propagation physics) is imprinted on (i) the difference in pre- and post-break flux spectrum slopes and (ii) on the break energies of the flux and composition spectra. We identified the following robust trends.
-
A knee induced by a fixed-rigidity cutoff in the CR source population exhibits a steep break in the all-particle spectrum, with a slope step of about 0.5. Diversity in the population (in either Ep, max or γ) tends to somewhat reduce the steepness of the break, but the effect is weak.
-
Diversity in Ep, max moves the flux break energy, Eb, and the composition break energy, EA, to lower values, with the composition being more strongly affected. In contrast, diversity in γ leaves EA practically unaffected, but moves Eb to higher energies.
-
Any diversity in either Ep, max or γ works to separate Eb from EA, in the same direction: The composition breaks first. The difference between the two can be as large as a factor of several, especially when Ep, max and γ vary substantially among population members.
Any qualitative deviation from these trends would require a model of significantly higher astrophysical complexity than we discussed here.
Several energy regimes exist in which this complexity is not only possible, but likely. Above ∼1019 eV, photo-hadronic and photo-disintegration interactions for protons and nuclei (GZK suppression; Greisen 1966; Zatsepin & Kuz’min 1966) shape the spectrum and composition independently of population effects. Pair-production losses above 1018 eV can produce an ankle-like feature, depending on composition (e.g., Berezinsky 2006). Transitions between distinct source classes (e.g., Galactic versus extragalactic, or between distinct extragalactic populations; e.g., Aab et al. 2017) can also impart features to CR spectrum and composition. Our framework did not model these channels, but was intended to test whether population effects alone might be the dominant driver of a given feature. When high-energy processes coact with population diversity, the qualitative trends we identified still provide exclusion tests. For example, a composition break preceding a spectral steepening below the GZK cutoff is a natural outcome of a population cutoff and remains consistent even when a separate GZK suppression operates at higher energy.
These insights can be used to qualitatively discuss whether each of the steepening features in the broadband cosmic-ray spectrum is a simple fixed-rigidity CR-source-cutoff knee, even without any detailed fits to a specific model or the underlying accelerator populations. The primary aim of this work was to search for robust features imprinted on the spectrum as a result of the specific physical processes that we included as ingredients in our model. Together with the intentional simplicity of our assumptions, our final product and prediction are the spectral features and their energy ordering themselves and not the detailed form of the spectrum. In this sense, the meaningful comparison with present (or future) cosmic-ray data is through exactly the comparison of our predictions with the presence and energy-ordering of breaks in the data. We compare this below.
For the primary CR knee at ∼4 × 10¹⁵ eV (Fowler et al. 2001; Antoni et al. 2005; Aartsen et al. 2013; Cao et al. 2024), the situation is still unclear because observations from different experiments and using different techniques have unfortunately not yet fully converged, even at the very coarse level needed for the type of comparison we sought. For example, early results presented in the Blümer et al. (2009) review, but also very recent results from the Large High Altitude Air Shower Observatory (LHAASO) experiment (Cao et al. 2024), indicate a small slope step (between 0.2 and 0.4) and a break in the composition after the spectrum. In the context of a simple fixed-rigidity source-cutoff knee described here, a small slope step might conceivably be achieved with a combination of variations in both Ep, max and γ in the population of contributing sources. This physical picture cannot accommodate the composition breaking after the spectrum, however. Even if we were to accept that within uncertainties, composition and spectrum might break together, this would indicate a population with very little spread in γ and Ep, max, which would then result in a sharper slope step than is observed. This combination of phenomenological observables then indicates a more complex picture, in which, for example, more than one source populations contributes cosmic rays around the primary knee, or in which additional physical effects are at play (e.g., Hillas 1979). On the other hand, in the latest post-LHC reanalysis of data from the KASCADE-Grande experiment (Haungs et al. 2017; Chiavassa et al. 2019), the composition already appears to become higher in mss before the break in spectrum, while the slope step is reported at ∼0.5, as expected from the simplest version of fixed-rigidity knee we explored here.
For the second knee around 5 × 10¹⁷ eV (see, e.g., Bergman & Belz 2007 for a review), the observational situation is similarly different. Different datasets disagree about the location of the composition break, and on whether before the break, the composition was becoming higher in mass (Cassiday et al. 1990) or lower (HIRES/Mia Collaboration 2001; Abbasi et al. 2005). The consensus is that the break is soft (slope step between 0.2 and 0.3), however, while the composition across the second knee is becoming lighter. Most likely, there is therefore a second low-mass (i.e., still efficiently accelerating) population in this case that contributes (e.g., Thoudam et al. 2016), which means that the simple physics we explored is not adequate to model this transition. More specifically, in dip/transition scenarios, the second knee marks the onset of the Galactic-to-extragalactic transition: The high-mass Galactic component fades, while a low-mass extragalactic component appears. In this case, the ankle reflects pair-production shaping of the extragalactic proton spectrum. Alternative models explored two Galactic components below the ankle in which an extragalactic contribution only became dominant closer to 1018.5–1019 eV. Either way, a changing population readily dilutes the slope step to Δγ ∼ 0.2–0.3 and can produce a lightening composition across the steepening. These features are incompatible with a single-population fixed-rigidity cutoff and are therefore fully consistent with our exclusion result for the second knee (Aloisio et al. 2008; Lemoine 2005; Thoudam et al. 2016; Apel et al. 2011, 2013b).
The knee-like new feature identified by the Pierre Auger Observatory in the cosmic-ray spectrum around 1019 eV (Aab et al. 2020) features a slope step of ∼0.5, which is exactly in the expected range for a fixed-rigidity source-cutoff knee. In this reading, the population-cutoff steepening would be distinct from and would precede the higher-energy GZK suppression, which would further steepen the spectrum at yet higher energies. This scenario would further support the interpretation that the break seen in composition-sensitive observables before the break in the spectrum (Yushkov 2019) indeed indicates a transition to higher-mass primaries and is not a signature of exotic physics (as in, e.g., Farrar & Allen 2013 or Pavlidou & Tomaras 2019). This is further reinforced by the reconstructed shape of the ⟨lnA⟩ spectrum. Although the overall normalization of the composition spectrum strongly depends on the choice for hadronic interaction modeling, the relative change in ⟨lnA⟩ with energy does feature the overall shape seen in the upper right panel of Fig. 1: ⟨lnA⟩ flattens between 1018 and 1018.5 eV before it starts to increase logarithmically around 1018.6 eV. Our interpretation therefore agrees overall with the interpretation proposed by Aab et al. (2020). Interestingly, however, the difference between the locations of the composition break (around 1018.6 eV when we follow the same procedure as used here to determine EA) and the spectrum break (reported by Aab et al. 2020 at 1019.1 eV) is higher than the differences produced by variations in Ep, max alone. The implication is that γ might also vary significantly in the dominant CR source population at these energies. This might in turn produce a non-negligible curvature in the spectrum before the break (see the dashed black line in Fig. 6) that might contribute to the curvature of the ankle, which is also located at the same energy as the composition break.
Acknowledgments
MF acknowledges support by the European Research Council under the European Union’s Horizon 2020 research and innovation program, grant agreement No. 771282 (PASIPHAE). VP acknowledges support by the Hellenic Foundation for Research and Innovation under the “First Call for H.F.R.I. Research Projects to support Faculty members and Researchers and the procurement of high-cost research equipment grant”, Project 1552 CIRCE, and by the Foundation of Research and Technology – Hellas Synergy Grants Program (project MagMASim). MF would like to thank Nick Loudas and Chryssi Koukouraki for their insightful comments and discussions.
References
- Aab, A., Abreu, P., Aglietta, M., et al. 2017, JCAP, 2017, 038 [CrossRef] [Google Scholar]
- Aab, A., Abreu, P., Aglietta, M., et al. 2020, Phys. Rev. D, 102, 062005 [NASA ADS] [CrossRef] [Google Scholar]
- Aartsen, M. G., Abbasi, R., Abdou, Y., et al. 2013, Phys. Rev. D, 88, 042004 [Google Scholar]
- Abbasi, R. U., Abu-Zayyad, T., Archbold, G., et al. 2005, ApJ, 622, 910 [Google Scholar]
- Aloisio, R., Berezinsky, V., Blasi, P., & Ostapchenko, S. 2008, Phys. Rev. D, 77, 025007 [Google Scholar]
- Amenomori, M., Ayabe, S., Bi, X. J., et al. 2008, Nucl. Phys. B Proc. Suppl., 175, 318 [Google Scholar]
- Antoni, T., Apel, W. D., Badea, A. F., et al. 2005, Astropart. Phys., 24, 1 [NASA ADS] [CrossRef] [Google Scholar]
- Apel, W. D., Arteaga-Velázquez, J. C., Bekk, K., et al. 2011, Phys. Rev. Lett., 107, 171104 [CrossRef] [PubMed] [Google Scholar]
- Apel, W. D., Arteaga-Velázquez, J. C., Bekk, K., et al. 2013a, Astropart. Phys., 47, 54 [NASA ADS] [CrossRef] [Google Scholar]
- Apel, W. D., Arteaga-Velàzquez, J. C., Bekk, K., et al. 2013b, Phys. Rev. D, 87, 081101 [NASA ADS] [CrossRef] [Google Scholar]
- Berezinsky, V. 2006, J. Phys. Conf. Ser., 47, 142 [Google Scholar]
- Bergman, D. R., & Belz, J. W. 2007, J. Phys. G Nucl. Phys., 34, R359 [Google Scholar]
- Bijay, B., & Bhadra, A. 2016, Res. Astron. Astrophys., 16, 6 [Google Scholar]
- Blümer, J., Engel, R., & Hörandel, J. R. 2009, Prog. Part. Nucl. Phys., 63, 293 [CrossRef] [Google Scholar]
- Cao, Z., Aharonian, F., Axikegu, et al. 2024, Phys. Rev. Lett., 132, 131002 [CrossRef] [PubMed] [Google Scholar]
- Cassiday, G. L., Cooper, R., Corbato, S. C., et al. 1990, ApJ, 356, 669 [Google Scholar]
- Chiavassa, A., Apel, W. D., Arteaga-Velázquez, J. C., et al. 2019, EPJ Web Conf., 208, 03002 [Google Scholar]
- Deligny, O. 2020, ArXiv e-prints [arXiv:2001.08811] [Google Scholar]
- Diesing, R. 2023, ApJ, 958, 3 [NASA ADS] [CrossRef] [Google Scholar]
- Ehlert, D., Oikonomou, F., & Unger, M. 2023, Phys. Rev. D, 107, 103045 [Google Scholar]
- Farrar, G. R., & Allen, J. D. 2013, EPJ Web Conf., 53, 07007 [CrossRef] [EDP Sciences] [Google Scholar]
- Fowler, J. W., Fortson, L. F., Jui, C. C. H., et al. 2001, Astropart. Phys., 15, 49 [CrossRef] [Google Scholar]
- Greisen, K. 1966, Phys. Rev. Lett., 16, 748 [Google Scholar]
- Haungs, A., Apel, W. D., Arteaga-Velázquez, J. C., et al. 2017, EPJ Web Conf., 145, 13001 [Google Scholar]
- Hillas, A. M. 1979, Int. Cosm. Ray Conf., 8, 7 [Google Scholar]
- Hillas, A. M. 1984, ARA&A, 22, 425 [Google Scholar]
- HIRES/Mia Collaboration 2001, Int. Cosm. Ray Conf., 1, 374 [Google Scholar]
- Hörandel, J. R. 2004, Astropart. Phys., 21, 241 [Google Scholar]
- Kimura, S. S., Murase, K., & Mészáros, P. 2018, ApJ, 866, 51 [NASA ADS] [CrossRef] [Google Scholar]
- Kotera, K., & Lemoine, M. 2008, Phys. Rev. D, 77, 023005 [NASA ADS] [CrossRef] [Google Scholar]
- Lemoine, M. 2005, Phys. Rev. D, 71, 083007 [NASA ADS] [CrossRef] [Google Scholar]
- Mollerach, S., & Roulet, E. 2019, JCAP, 2019, 017 [Google Scholar]
- Mukhopadhyay, P., Peretti, E., Globus, N., Simeon, P., & Blandford, R. 2023, ApJ, 953, 49 [Google Scholar]
- Muzio, M. S., Anchordoqui, L. A., & Unger, M. 2024, Phys. Rev. D, 109, 023006 [Google Scholar]
- Nagano, M., Hara, T., Hatano, Y., et al. 1984, J. Phys. G Nucl. Phys., 10, 1295 [Google Scholar]
- Pavlidou, V., & Tomaras, T. 2019, Phys. Rev. D, 99, 123016 [CrossRef] [Google Scholar]
- Peters, B. 1961, Il Nuovo Cimento (1955–1965), 22, 800 [Google Scholar]
- Sanchez-Lucas, P. 2017, in Proceedings of 35th International Cosmic Ray Conference– PoS(ICRC2017), 301, 495 [Google Scholar]
- Sveshnikova, L. G. 2003, A&A, 409, 799 [NASA ADS] [CrossRef] [EDP Sciences] [Google Scholar]
- Guido, E., The Pierre Auger Collaboration, Abreu, P., et al. 2022, in 37th International Cosmic Ray Conference, 311 [Google Scholar]
- Thoudam, S., Rachen, J. P., van Vliet, A., et al. 2016, A&A, 595, A33 [NASA ADS] [CrossRef] [EDP Sciences] [Google Scholar]
- Workman, R. L., Burkert, V. D., Crede, V., et al. 2022, Prog. Theor. Exp. Phys., 2022, 083C01 [CrossRef] [Google Scholar]
- Yushkov, A. 2019, Int. Cosm. Ray Conf., 36, 482 [Google Scholar]
- Yushkov, A., Bellido, J., Belz, J., et al. 2019, EPJ Web Conf., 210, 01009 [CrossRef] [EDP Sciences] [Google Scholar]
- Zatsepin, G. T., & Kuz’min, V. A. 1966, Soviet. J. Exp. Theor. Phys. Lett., 4, 78 [Google Scholar]
- Zhao, Y., Jia, H.-Y., & Zhu, F.-R. 2015, Chin. Phys. C, 39, 125001 [Google Scholar]
All Figures
|
Fig. 1. All-particle flux and composition spectra in the case of a lognormal p(Ep, max). Upper left panel: All-particle flux spectrum flattened by Eγ. Upper right panel: composition spectrum. Lower left panel: Broken power-law fit around the knee for the flux spectrum. The crosses correspond to mock observations obtained from our model. The solid line shows the fit of Eq. (12). Lower right panel: Low- and high-energy asymptotic logarithmic fits to the composition spectrum (solid green and red lines, respectively). The points again correspond to mock data obtained from our model. The composition break energy is given by the intersection of the two lines (black star). |
| In the text | |
|
Fig. 2. Values of the spectral power indices γ1 and γ2, indicated with red and blue points respectively, as a function of |
| In the text | |
|
Fig. 3. Energies of the composition break (red) and the flux break (blue) in units of |
| In the text | |
|
Fig. 4. As in Fig. 2, but using the initial CR composition taken from Apel et al. (2013a), which is more appropriate for energies above the knee. |
| In the text | |
|
Fig. 5. As in Fig. 3, but using the initial CR composition taken from Apel et al. (2013a), which is more appropriate for energies above the knee. |
| In the text | |
|
Fig. 6. All-particle spectrum flattened by |
| In the text | |
|
Fig. 7. Values of the spectral power indices γ1 and γ2, indicated with red and blue points, respectively, as a function of σγ. |
| In the text | |
|
Fig. 8. Energies of the composition break (red) and the flux break (in blue) in units of Ep, max as a function of σγ. |
| In the text | |
Current usage metrics show cumulative count of Article Views (full-text article views including HTML views, PDF and ePub downloads, according to the available data) and Abstracts Views on Vision4Press platform.
Data correspond to usage on the plateform after 2015. The current usage metrics is available 48-96 hours after online publication and is updated daily on week days.
Initial download of the metrics may take a while.