Fig. 2
Download original image
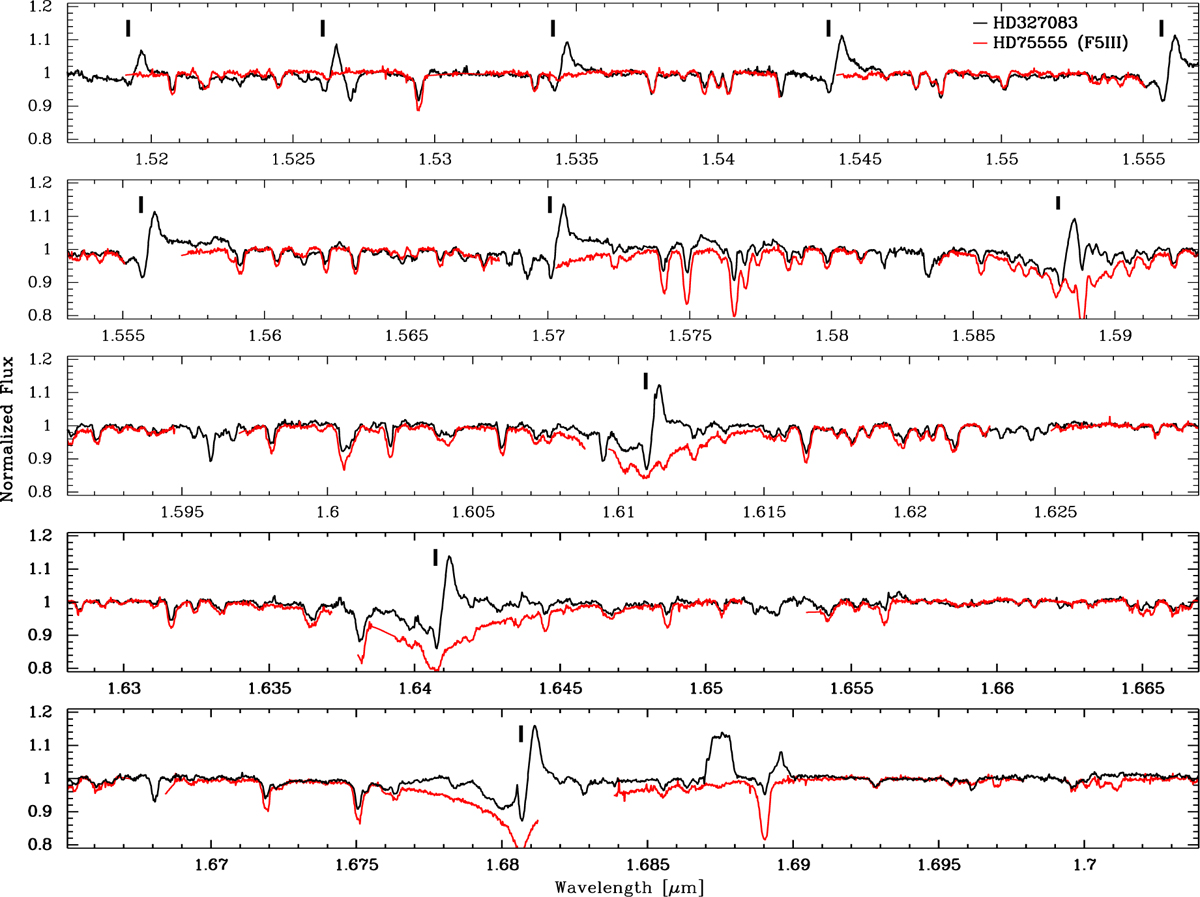
Portion of the IGRINS H-band spectrum. This region is dominated by photospheric lines (of H I and metals) from an F-type star. Emission lines with P Cygni profiles correspond to H I (indicated with ticks) and Fe II (seen in the 1.687–1.690 µm region). These lines are formed in the disc around the B-type companion. For comparison purposes, an F5 III star is overplotted (shown in red).
Current usage metrics show cumulative count of Article Views (full-text article views including HTML views, PDF and ePub downloads, according to the available data) and Abstracts Views on Vision4Press platform.
Data correspond to usage on the plateform after 2015. The current usage metrics is available 48-96 hours after online publication and is updated daily on week days.
Initial download of the metrics may take a while.