| Issue |
A&A
Volume 706, February 2026
|
|
|---|---|---|
| Article Number | A309 | |
| Number of page(s) | 15 | |
| Section | Stellar atmospheres | |
| DOI | https://doi.org/10.1051/0004-6361/202451636 | |
| Published online | 20 February 2026 | |
New constraints on the binary system HD 327083 and its gaseous and dusty environments
1
Facultad de Ciencias Astronómicas y Geofísicas, Universidad Nacional de La Plata,
Paseo del Bosque S/N,
1900
La Plata,
Argentina
2
Instituto de Astrofísica La Plata, CCT La Plata, CONICET,
Paseo del Bosque S/N,
1900,
La Plata,
Argentina
3
Astronomical Institute, Czech Academy of Sciences,
Fričova 298,
251 65
Ondřejov,
Czech Republic.
4
Instituto de Física y Astronomía, Facultad de Ciencias, Universidad de Valparaíso,
Av. Gran Bretaña 1111,
Valparaíso,
Chile
5
Observatório Nacional – MCTI,
Rua General José Cristino 77,
20921–400
São Cristovão,
Rio de Janeiro,
Brazil
6
Centro Multidisciplinario de Física, Vicerrectoría de Investigación, Universidad Mayor,
8580745
Santiago,
Chile
7
IASSARS, National Observatory of Athens,
Athens,
Greece
8
Institute of Astrophysics, FORTH,
Heraklion,
Greece
9
Sorbonne Université, CNRS, UPMC, UMR7095,
Paris,
France
10
Institut d’Astrophysique de Paris,
98bis Bd. Arago,
75014
Paris,
France
★ Corresponding author: This email address is being protected from spambots. You need JavaScript enabled to view it.
Received:
24
July
2024
Accepted:
26
December
2025
Abstract
Context. Binary systems with circumbinary molecular and dust rings are of great interest because they provide insights into the dynamics and evolution of stellar systems and the chemistry of the surrounding material.
Aims. We aim to elucidate the nature of the B[e] binary system HD 327083 and constrain its orbital parameters and evolutionary status as well as the physical properties of its circumstellar and circumbinary envelopes.
Methods. We present multi-epoch high-spectral resolution optical and near-infrared observations acquired at various observatories combined with VLTI/MIDI observations and ASAS-3 photometry. The data were analysed to obtain the orbital parameters, study individual members of the system, and derive the properties of the atomic and molecular gas and the dusty components of the complex environment of HD 327083.
Results. We improved the orbital solution of HD 327083 and derived a period of P = 107.699 ± 0.005 d. Most optical lines display variations in shape and intensity when folded with the orbital motion. We assigned F6 II-III and B1 spectral types respectively to the cool and hot stellar components. A ring of molecular gas revolves around the system, and its appearance varies with the orbital phase. The MIDI flux distribution shows a silicate band in absorption at 9.7 µm. The interferometric data also indicate that the dust distribution has an elliptical shape, with its inner edge varying with orbital phase between 12.5 AU and 44 AU.
Conclusions. We conclude that the B[e] binary system HD 327083 comprises a B-type massive accreting star and an F-type companion filling over 60% of its Roche lobe. The F-type companion is evolving towards the red supergiant stage. The deformed shape of the F-type star causes a broad minimum in the light curve. The hot companion (26 000 K, log g = 3.0) is hidden by a compact disc and shows a bi-polar outflow. The entire binary system presents an O-rich environment. It is surrounded by warm CO and SiO molecular rings, which are enclosed by an elliptical dust structure. All these components were formed by the evolved donor star during its evolution towards the red supergiant phase.
Key words: techniques: interferometric / techniques: spectroscopic / circumstellar matter / stars: early-type / stars: emission-line, Be / stars: individual: HD 327083
Member of the Carrera del Investigador Científico, CONICET, Argentina.
© The Authors 2026
 Open Access article, published by EDP Sciences, under the terms of the Creative Commons Attribution License (https://creativecommons.org/licenses/by/4.0), which permits unrestricted use, distribution, and reproduction in any medium, provided the original work is properly cited.
This article is published in open access under the Subscribe to Open model. This email address is being protected from spambots. You need JavaScript enabled to view it. to support open access publication.
1 Introduction
Galactic B[e] supergiants (B[e]SGs) are luminous and massive post-main-sequence stars (Lamers et al. 1998). They typically exhibit UV broad blue-shifted absorption lines of highly ionised atoms, narrow permitted and forbidden low-excitation optical emission lines at low expansion velocities, and a strong near/mid-infrared (near/mid-IR) excess. The large infrared emission is attributed to dust particles in the outer parts of the equatorial regions. Some B[e]SGs present high-density equatorial discs that substantially form molecules in a transition zone between the atomic gas and dusty regions (Kraus 2019).
To explain the observed hybrid line spectrum of B[e]SGs, Zickgraf et al. (1985) proposed an empirical model that consists of an evolved B-type star with a hot and fast line-driven wind in the polar region and a much cooler and denser slow wind (of a factor of 102 to 103 times higher) in the equatorial zone. Numerical predictions from bi-stable radiation-driven winds in rapidly rotating stars (with Veq/Vc > 0.7, being Veq the equatorial linear velocity and Vc the critical velocity of rotation) support the previous scenario (Curé et al. 2005). These calculations show that a change in the line-force parameters, occurring in the region of the bi-stability jump, might yield density contrasts between polar and equatorial zones of a factor of about 102 to 104 in an environment near the stellar surface (r≤2 R⋆).
However, evidence increasingly indicates that luminous B[e] stars have detached non-homogeneous circumstellar or circumbinary envelopes in Keplerian rotation (Cidale et al. 2012; Marchiano et al. 2012; Wheelwright et al. 2012a,b), and these discs may present multi-ring structures (Kraus et al. 2016; Maravelias et al. 2018; Torres et al. 2018). Plausible explanations for the B[e] phenomenon among B-type supergiants are related to either rapid stellar rotation (Langer & Heger 1998; Kraus et al. 2007, Kraus et al. 2008) or mass transfer in binary systems (Podsiadlowski et al. 2006; Kraus et al. 2013). In the past few years, several binary systems with primary B[e]SG signatures have been detected (or confirmed) thanks to spectroscopic or interferometric techniques: V 921 Sco (Kraus et al. 2012), MWC 300 (Wang et al. 2012), and HD 327083 (Miroshnichenko et al. 2003).
We aim to undertake a new study of the binary system HD 327083 to better constrain its orbital parameters and evolutionary status as well as the physical properties of its circumstellar and circumbinary envelopes (size, density, temperature, and dynamics). A thorough knowledge of binary systems is key to understanding the origin and evolution of stars showing the B[e] phenomenon and the processes leading to molecular and dust disc formation.
This paper is structured in the following way. In Sect. 2, we briefly describe our current knowledge of HD 327083. Our observations are described in Sect. 3, and data analysis and modelling are given in Sect. 4. In Sect. 5, we discuss our new results, summarising our main conclusions in Sect. 6.
2 The binary
The object HD 327083 (J=2000, α = 17h15m15.37s; δ = −40◦ 20′ 06.79″, V = 9.81 mag, and K = 3.3 mag) is a very reddened P Cygni-type star with E(B − V) ∼ 1.9 mag (Kozok 1985a). The star exhibits a strong emission-line spectrum, mainly of H I, He I and Fe II transitions (Carlson & Henize 1979). Lopes et al. (1992) reported that the He I λ5875 Å line was seen in absorption while the Fe II and H I lines displayed P Cygni profiles.
Olnon et al. (1986), using IRAS satellite, detected a strong mid-IR flux, with a steep decrease towards longer wavelengths and a featureless spectrum in the 10 µm region. Near-IR spectroscopy also showed strong CO emission features at 2.3 µm (Whitelock et al. 1983; McGregor et al. 1988) and emission from the SiO first overtone bands arising in the L band (Kraus et al. 2015).
The star’s spectral type is still quite uncertain: it was classified into sub-classes B5 (Henize 1952), B8 (Carlson & Henize 1979), B6 Ieq (Lopes et al. 1992), and B2 (Miroshnichenko et al. 2003). However, theoretical fittings of the observed Hα and Hβ P Cygni line profiles done by Machado et al. (2001) suggested two very different sets of effective temperatures, either 9000 K or 19 000 K. Furthermore, both models predicted very high luminosity (≥5 × 10⁵ L⊙) and mass-loss rate (≥4.9 × 10⁻⁵ M⊙ yr−1). Later, Miroshnichenko et al. (2003) reported the presence of numerous absorption lines of neutral metals that appear to belong to the photosphere of a moderately cool star. These authors also found radial velocity (RV) variations in both emission and absorption lines that vary in anti-phase. They suggested that HD 327083 should be a binary system seen edge-on, in which the hot (primary) companion was proposed to be a B1–B3 star, while the cool companion (secondary) is an F-type star. For HD 327083, they also estimated a distance of about 1.5 ± 0.5 kpc. Wheelwright et al. (2012a) confirmed HD 327083 as a Galactic B[e]SG based on the presence of 13CO emission. Moreover, Wheelwright et al. (2012b) concluded that the CO-forming region originates in a circumbinary Keplerian disc. The inner edge of the best-fitting CO disc is approximately 3 ± 0.3 AU. These authors found no evidence of a variable CO first overtone emission. Based on VLTI/AMBER observations, Wheelwright et al. (2012a) also supported the binary nature of HD 327083 and the best-fitting model revealed the presence of an elongated circumbinary Keplerian disc where the near-IR excess is originating. For their analysis, they adopted the distance of 1.5 ± 0.5 kpc derived by Miroshnichenko et al. (2003). However, updated measurements of the star’s parallax provided by Gaia EDR3 place the star at a significantly greater distance, d = 2.448 ± 0.145 kpc (Gaia Collaboration 2020).
More recently, Maravelias et al. (2018) reported that HD 327083 displays strong line variations, both in intensity and shape (over the 1999–2016 period) folded with an orbital period of 107.687 d (see also Nodyarov et al. 2024). In addition, Maravelias et al. (2018) found that the gaseous component traced by the [Ca II] and [O I] lines lays in the circumbinary rings. The rotation velocities found for the [Ca II] and [O I] forming regions are similar to that of the SiO ring, which implies a common location for these gases. The CO molecule forms (at a slightly higher rotational velocity) in another ring closer to the binary system.
This binary system was independently and simultaneously studied by two research groups: Nodyarov et al. (2024) and the authors of the present work. This paper also reviews the orbital parameters and examines the structure and properties of the circumbinary gaseous and dusty discs.
3 Observations
We used different facilities to perform optical and near-IR high-resolution spectroscopic observations of the HD 327083 binary system. Our study was also complemented by analysing mid-IR interferometric observations and photometric data. All observations were conducted on various epochs between 1999 and 2021.
3.1 Optical spectroscopic data
High-resolution (R ∼ 48 000) optical observations were obtained using the Fiber-fed Extended Range Optical Spectrograph (FEROS, Kaufer et al. 1999). This spectrograph was attached to the 1.52-m ESO telescope between 1999 and 2002 and, later, to the 2.2-m MPG telescope (La Silla, Chile). The science object and sky spectra were simultaneously acquired using the Object-Sky (OBJSKY) mode. All the spectra were reduced with the FEROS pipeline.
An additional set of observations was taken with the REOSC echelle Cassegrain spectrograph in cross dispersion mode mounted at the 2.15-m Jorge Sahade (JS) telescope at the Complejo Astronómico El Leoncito (CASLEO, San Juan, Argentina). We selected the following instrumental configuration: a 400 ℓ mm−1 grating (blazed at 4000 Å), a slit width of 250 µm, and a TEK 1024×1024 CCD. Th–Ar comparison lamp spectra were taken to perform the wavelength calibration. The covered spectral region ranges from 4075 Å to 6900 Å with a resolving power of R = 12 500. A standard spectral reduction procedure was applied using IRAF1 tasks.
Low-resolution spectra were also obtained with the Boller & Chivens (B&C) spectrographs attached to the 1.6-m Perkin-Elmer telescope at the Laboratório Nacional de Astrofísica (LNA), Brazópolis, Brazil, on 2012, April 12 and to the JS telescope (CASLEO, Argentina) on 2017, June 11. For the former spectrum, a grating of 600 ℓmm−1, a slit width of 400 µm, and a Marconi CCD 42-40-1-368 (2048 × 2048 pixels) detector were selected. This instrumental configuration provides a 2.12 Å dispersion every two pixels (R = 1 200). For the B&C spectrum of 2017 (R ∼ 700), we used the TEK 1024 × 1024 CCD, a grating of 600 ℓmm−1, and a slit width of 350 µm. Both spectra cover the interval 3500–5000 Å. A comparison lamp of He–Ar was used to perform the wavelength calibration. The flux calibration was performed by observing flux standard stars selected from Hamuy et al. (1994). The reduction procedure was done with IRAF tasks. The ‘apscatter’ task was also used to subtract the background (scattered light and sky).
The log of spectroscopic observations is listed in Table 1: columns 1 and 2 provide observation and Julian dates, while columns 3, 4, 5, and 6 give, in turn, the instrument used, exposure time, wavelength range, and orbital phase (calculated with the orbital period of 107.699 days and the time of conjunction (Tc) found in this work, see Sect. 4.2 and Table 5).
Log of optical spectroscopic observations of HD 327083.
3.2 Light curve
The light curve of HD 327083 is available in the All Sky Automated Survey (ASAS) Photometric V-band Catalogue (Pojmanski 1997). Particularly, ASAS-3 provides light curves for objects south of declination +28◦ during the years 2000–2009. The light curve has been presented by Maravelias et al. (2018). Here, it is used to complement the information obtained from spectroscopy.
Log of near-IR spectroscopic observations.
3.3 Near-IR spectroscopic observations
To study the CO molecular band heads around 2.3 µm, we used high-resolution IR spectra (R ∼ 50 000) of HD 327083, acquired with the visitor instruments Phoenix (Phoenix Infrared High-Resolution Spectrograph, Hinkle et al. 2003, 1998) and IGRINS (Immersion GRating INfrared Spectrometer, Park et al. 2014) spectrographs mounted on the 8.1-m Gemini South telescope (Cerro Pachón, Chile). The Phoenix observations were taken in service mode under programs GS-2010A-Q-41 and GS-2017A-Q-30, while the IGRINS spectra were acquired under program GS-2021A-Q-401. In 2010, Phoenix observations were taken with the K4308 filter centred at 2.323 µm and the Aladdin 512 × 1024 InSb array as the detector. In 2017, the first CO band head was observed with the filters K4396 and K4308, centred at 2.294 µm and 2.323 µm, respectively. The completely covered wavelength intervals are 2.289–2.299 µm and 2.319–2.328 µm. The spectrograph IGRINS provides a resolving power of R ∼ 45 000 with a wavelength range in the H and K bands of 1.49–1.78 µm and 1.97–2.42 µm, respectively.
An offset pattern ABBA (science-sky-sky-science) nodding along a 4−pixel wide slit was applied to remove the sky emission. Phoenix and IGRINS spectra were reduced using IRAF software routines and the IGRINS pipeline package2, respectively. The basic reduction steps were subtraction of the AB pairs, flat fielding, wavelength calibration, and telluric correction. To apply the telluric correction, we selected a B late-type (B9 V) standard star observed immediately before (or after) our science object. In all the cases, the telluric features were removed with the telluric task from the IRAF packages. The final spectra were normalised to the continuum.
To supplement the data analysis, we also used the spectra available in the whole wavelength range 2.277–2.325 µm taken with the CRyogenic high-resolution InfraRed Echelle Spectrograph (CRIRES; Kaeufl et al. 2004) mounted on the 8.2-m telescope at ESO-VLT (Paranal, Chile). The reduction procedure is described in Maravelias et al. (2018), who discussed only the first CO band-head spectrum.
Table 2 gives the log of the near-IR spectroscopic observations: columns 1 and 2 provide the observation and Julian dates, respectively. Columns 3, 4, 5, and 6 give information on the instrument used, the exposure time, the covered wavelength range, and the phase related to the orbital motion.
Observation log of VLTI/MIDI.
3.4 Interferometric observations
The object HD 327083 was observed at the Paranal ESO Observatory (Chile) in service mode (ESO Program ID: 085.D-0454(B)) with the Very Large Telescope Interferometer (VLTI) and the MID-infrared Interferometric instrument (MIDI; Leinert et al. 2004). MIDI is a Michelson-type interferometer with a half-reflecting plate optical recombiner. It combines signals from two telescopes of the Very Large Telescope (VLT) array, using either two 8.2-m unit telescopes (UTs) or two 1.8-m auxiliary telescopes.
Three datasets were taken at different projected baseline lengths (Bp) and position angles (PA) in 2010 April, and May, using the UT2–UT3 and UT3–UT4 baselines. Table 3 summarises the observation log: date, time of observation (Coordinated Universal Time = UTC), the configuration of the interferometer, projected baseline lengths (Bp), position angles of the projected baseline on the sky (PA), and the orbital phase (ϕ) of the observation date calculated using the period of the binary system obtained in this work.
Both N-band spectrum and the spectrally dispersed fringes were recorded between 8.4 µm and 13 µm with a spectral power of R = 30. Data reduction was done with MIA+EWS packages (Jaffe 2004; Leinert et al. 2004). As calibrator stars, we used HD 159433: θUD = 2.07 ± 0.13 mas, and F12 = 9.27 Jy and HD 152980: θUD = 3.64 ± 0.12 mas, and F12 = 22.03 Jy3.
4 Results
4.1 Spectral classification and stellar parameters
The FEROS optical spectra present numerous metallic absorption lines of neutral and singly ionised elements (e.g. Si II, Ca I, and Fe I) typically observed in a mid-F-type star. All the absorption lines show RV variations. Superimposed on the F-type spectrum are prominent double-peaked emissions of Fe II lines and P Cygni profiles from H I and He I, indicating the presence of a gaseous disc around a hot companion and a (most likely) bipolar wind seen under some inclination angle relative to the line of sight. We could not detect any purely photospheric absorption line corresponding to the hot star.
The FEROS spectra were compared with solar-abundance synthetic spectra generated using MARCS model atmospheres and the TURBOSPECTRUM synthesis code, as part of the AMBRE project (de Laverny et al. 2012). These synthetic spectra are accessible through the POLLUX database4 (Palacios et al. 2010). The best fit to the normalised optical spectrum of HD 327083, near the minimum brightness (see Sect. 4.3 for the light curve analysis), was achieved for a Teff = 6750 K and log g = 3.5 (see Fig. 1, red curves compared to observations in black). An atmospheric plane-parallel model with a lower surface gravity (log g = 2.0, green solid line) predicts deeper absorption lines. Models with lower values of log g are discarded, as they provide poor fits to the observed spectra. The discrepancy between each model and the observation is subtle. A model with log g = 2.0 tends to better fit the spectral lines that are more sensitive to luminosity. This model is also more consistent with the evolutionary state inferred for the binary system (see Sect. 5.3). However, none of the models match the intensity of the O I triplet, which shows contamination with a broad feature. All synthetic spectra were modified to match the FEROS spectral resolution and line broadening to account for the star’s projected rotational velocity, requiring a value of v sin i = 22 km s−1.
Photospheric absorption lines of an F5 or F6 III-type star are also noticeable in the IGRINS spectrum taken in the near-IR region. Figure 2 illustrates the H-band spectral region of HD 327083, which is compared with an F5 III star taken from the IGRINS library. In this spectral region, we also observed a combined spectrum of photospheric absorption Pfund lines from the cool star and emissions of H I arising from a gaseous disc. The He I lines have P Cygni profiles.
The B&C low-resolution spectra are shown in Fig. 35. The appearance of the spectrum changes with orbital motion. The spectrum taken in 2012, at ϕ = 0.87, shows a hot source (revealed through a negative Balmer continuum slope) and H I lines with P Cygni profiles. The spectrum from 2017 (taken at ϕ = 0.37) does not show a negative Balmer continuum slope nor prominent P Cygni line profiles. Only Hβ and some Fe II lines are observed in emission. The spectra present a small (or even absent) Balmer jump, D ∼ 0.03 dex (D is the height of the Balmer discontinuity according to the BCD spectrophotometric classification system, Chalonge & Divan 1973; Zorec et al. 2009; Zorec 2023) which is consistent with late-F or early B-type stars. The presence of photospheric Ca II lines (being the K component blended with a Balmer line) also suggests a mid-F type star. These characteristics reveal that the dominant continuum radiation source comes from a cool star.
Figure 4 shows the spectral energy distribution (SED) of HD 327083, which is composed of different photometric bands, our B&C and MIDI spectra, together with observations from the Spitzer Heritage Archive and the International Ultraviolet Explorer (IUE). To model the SED, we follow the works of Zorec (1998), Muratore et al. (2011), and Marchiano et al. (2012), where the stellar object is surrounded by a gaseous shell, characterised by a mean or effective radius RG, near the star, while dust shells, of radii RD, lie farther out. Each shell contributes to the attenuation of stellar radiation and re-emits energy according to its local physical conditions. Assuming that the geometrical depth of each shell is smaller than its distance to the star, RG or RD, the emergent intensity can be calculated by applying a plane-parallel radiative transfer solution (see details on the geometrical model in Cidale & Ringuelet 1989; Moujtahid et al. 1999; Marchiano et al. 2012). To model the central stellar object, we combine the spectral energy distribution of the underlying cool and hot stars by scaling fluxes from the atmospheric models of Castelli & Kurucz (2003), assuming various radius ratios.
Since our SED calculation is based on a simplified model, it does not include the variations in the extinction profile expected for different dust components. Thus, the optical depths of gas and dust are calculated using different total-to-selective extinction ratios (RV = AV/E(B − V)), and the extinction law given by Cardelli et al. (1989). Dust shells are assumed to be optically thin, and the temperature distribution is described using a power-law relation, TD(r) = Teff (2 r/R⋆)−2/(4+p). The parameter p accounts for the absorption properties of dust grains (typically p = 1, see Lamers & Cassinelli 1999, Eq. (2.27)).
The best fit to the SED was achieved for atmospheric models of a cool star of 6750 K along with a hot star of 26 000 K and a hot-to-cool component radius ratio of R2/R1 = 0.14. We adopted log g = 2.0 and log g = 3.5 for each star, respectively. We also derived a total colour excess of E(B − V) = 1.4 mag, assuming RV = 3.1, which is consistent with a diffuse interstellar medium. A gaseous shell is found at RG = 1.1 R1 (where R1 is the radius of the cool star) with a TG = 16 000 K. This gaseous shell produces an attenuation of 0.06 mag. Its main effect is to enhance the continuum flux in the spectral region where the maximum occurs. Four dust shells of radius RD were necessary to fit the mid-IR region accurately (RD = 30 R1, TD = 1 360 K; RD = 60 R1, TD = 1030 K; RD = 150 R1, TD = 715 K; RD = 1700 R1, TD = 270 K). To model the dust component, we required a value of RV = 3.7. Therefore, dust grains appear to be of circumbinary origin and larger than the typically interstellar ones, resulting in an additional extinction of ∼0.9 mag.
In summary, based on the optical and IR data study, we assigned the spectral types F6 II-III (Teff = 6750 ± 150 K, log g = 2.0 ± 0.5) and B1 (Teff = 26 000 ± 2500 K, log g = 3.0 ± 0.5) to the binary system’s cool and hot star components, respectively. The binary system is surrounded by dust composed of processed material. The luminosity and masses of the binary components are discussed in Sect. 5.3.
 |
Fig. 1 Spectrum from FEROS of HD 327083 taken on 2017, August 26 (solid black line) compared with MARCS atmospheric models of 6600–6750 K for log g = 2.0 and log g = 3.5 (solid green and red lines, respectively). This region is dominated by photospheric lines (of H I and metals) from a late F-type star. The emission lines are formed in the disc of the hot companion: He I (P Cygni profiles), Hα, and Fe II lines. |
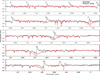 |
Fig. 2 Portion of the IGRINS H-band spectrum. This region is dominated by photospheric lines (of H I and metals) from an F-type star. Emission lines with P Cygni profiles correspond to H I (indicated with ticks) and Fe II (seen in the 1.687–1.690 µm region). These lines are formed in the disc around the B-type companion. For comparison purposes, an F5 III star is overplotted (shown in red). |
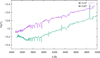 |
Fig. 3 Low-resolution optical spectrum at different phases showing variation in the line intensity and the Balmer continuum. |
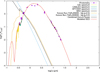 |
Fig. 4 Spectral energy distribution and the best-fitting model (in solid red line, see details in the text). Photometric data were taken from Kozok (1985b); Cutri et al. (2003); Egan et al. (2003); Miroshnichenko et al. (2003); Ishihara et al. (2010); Cutri et al. (2012); Gaia Collaboration (2020); Marton et al. (2024). The Spitzer and IUE spectra were taken from their corresponding archives. |
Radial velocity measurements at different orbital phases.
4.2 Orbital parameters
From the analysis of FEROS and CASLEO spectra, we derived average values of RV measurements corresponding to the photo-spheric metallic lines of Si II λλ 6347, 6371 Å, Ca I λ 6162 Å, Ca I λλ 6439, 6449, 6462, 6471 Å, and Ca I λ 6717 Å, which are given in Table 4, column 4. The RVs of the emission line Fe II λ6084 Å are listed in column 5.
We used the RVs from the metallic lines to improve the binary system’s orbital solution. These values were combined with data published by Miroshnichenko et al. (2003) to calculate the resulting RV curve, shown in Fig. 5. The best-fitting model was obtained by minimizing  , where O and C are the observed and calculated RV values, respectively. We used the same weight, wi, for all the data. The residual values are plotted in Figure 6. It can be seen that the absolute errors in the RVs do not exceed 2.7 km s−1.
The improved parameters of the orbital solution are listed in Table 5. We derived a period of P = 107.699 ± 0.005 days (very similar to that reported in Maravelias et al. 2018; Nodyarov et al. 2024) and an RV semi-amplitude K = 49.55 ± 0.42 km s−1. The rest of the parameters listed in the table are the barycentric RV of the system (γ0), the eccentricity (e), and the time of periastron passage (T0), with their respective errors. Tc corresponds to a minimum brightness epoch observed in the ASAS-3 light curve and defines a zero phase.
The average of the RV measurements of the emission lines Fe II λλ5991, 6084 Å, also shown in Fig. 5 (top panel), exhibits anti-phased behaviour when compared to the photospheric lines of the cool component, supporting the results of Miroshnichenko et al. (2003) and Nodyarov et al. (2022). As all the absorption lines used for the analysis correspond to the late-type star, the presence and RV behaviour of emission lines suggest that they arise in a disc around the hot component.
The mass function of our system, f (m), can be obtained from
 (1)
where K1 and M1 are the RV semi-amplitude and mass of the cool companion (the F-type star, since it is the main contributor to the optical spectrum) respectively, M2 is the mass of the emission-line B-type star, i the orbit inclination, G the gravitational constant, P the orbital period, and e the eccentricity. With the values adopted in Table 5, we find f (m) = 1.357 ± 0.002 M⊙.
(1)
where K1 and M1 are the RV semi-amplitude and mass of the cool companion (the F-type star, since it is the main contributor to the optical spectrum) respectively, M2 is the mass of the emission-line B-type star, i the orbit inclination, G the gravitational constant, P the orbital period, and e the eccentricity. With the values adopted in Table 5, we find f (m) = 1.357 ± 0.002 M⊙.
Due to the uncertainty in the inclination angle i of the orbital plane, the mass M2 of the emission-line object becomes indeterminate. Nevertheless, we can estimate a range of mass values considering that the mass M2 is q times the mass M1 of the F-type star (donor star). Thus, the mass function, f (m), is now expressed in terms of the parameter q as
 (2)
(2)
The mass function depends on the mass of the donor component and the inclination angle i. Moreover, as the RV curve traced by the emission lines has almost the same amplitude as that of the late-type star (K1 ∼ K2), this implies q ∼ 1. A lower amplitude would lead to a higher stellar mass. Therefore, the minimum mass expected for the emission-line star companion is when q = 1 (see discussion in Sect. 5).
Orbital parameters of the binary system.
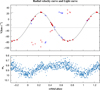 |
Fig. 5 Radial velocity curve and ASAS-3 light curve. Top panel: best-fitting RV curve (phase diagram) obtained with a period of 107.699 days using our data (red symbols) and those published by Miroshnichenko et al. (2003, blue symbols). Circle symbols follow the orbital motion of the F-type star (photospheric lines), and asterisks are for Fe II emission lines. The horizontal line indicates the barycentric RV of the system, γ0 = −29 km s−1. Bottom panel: ASAS-3 light curve as a function of the orbital phase (see details in section 4.3). The zero phase was calculated using the epoch Tc, when the cool component is located between the observer and the hot component. |
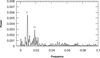 |
Fig. 7 Periodogram of the ASAS-3 light curve showing two dominant frequencies, F1 = 0.0092772 d−1 (P = 107.79 d) and F2 = 0.018579 d−1 (53.82 d). |
4.3 Light curve analysis
The light curve of HD 327083 is available in the ASAS Photometric V-band Catalogue (Pojmanski 1997). Based on the discrete Fourier transform algorithm and a least-squares fitting, we performed a time series analysis of the ASAS-3 light curve with the Period04 software (Lenz & Breger 2014). The power spectrum is shown in Fig. 7. Two significant frequencies are detected. The first frequency yields a period of P = 107.79 d, and the second one identifies its second harmonic, P = 53.82 d. The first period is very close to the one derived from our orbital solution (P = 107.699 d). Figure 5 (bottom panel) illustrates the light curve folded with the orbital phase, adopting the period given in Table 5. A deep and broad minimum occurs when the F-type star is located between the observer and the B-type star (ϕ = 0). A shallow minimum is observed at ϕ = 0.5. According to the model by Nodyarov et al. (2024, in their Fig. 4), the characteristic shape of a nearly Roche-lobe-filling star combined with reflection effects caused by illumination from the hot star and its accretion disc leads to a double-wave modulation in the light curve over the orbital period, as seen in Fig. 5 (bottom panel).
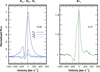 |
Fig. 8 Optical and near-IR H lines. Left panel: line profiles of Hα, Hβ, and Hγ at ϕ = 0.08. Right panel: P Cygni profile of the Brγ line at ϕ = 0.57. |
4.4 Optical and near-IR spectra
In this section, we briefly describe the most prominent spectral lines. We then examine their time evolution over the orbital period.
(a) H lines: The Hα and Hβ lines display a blue-shifted absorption with emission components at both sides (a P Cygni type V profile, Beals 1953) during almost the whole orbital cycle (see Fig. 8, left panel). At ϕ = 0.08, the Hα emission is 7 times the continuum level, while the Hβ emission line is only twice. The RV of the absorption component of Hα and Hβ cores are respectively −70 km s−1 and −66 km s−1 (corrected by the barycentric RV of the orbital motion). The Hγ line presents, in addition to a narrow absorption component at −43 km s−1, a typical P Cygni profile with an extended blue-shifted absorption with a RV of −276 km s−1 at the blue edge. The Brγ line (shown on the right panel of Fig. 8) displays a P Cygni profile with a barycentric corrected RV of −139.7 km s−1 at the blueward-absorption core when the orbital phase is 0.57. The emission component is somewhat asymmetric. The rest of the lines of the Brackett series are formed by the overlapping of H absorption lines of the F-type star and emission features from the hot circumstellar envelope, giving a ‘fake’ appearance of a P Cygni profile.
Figure 9 shows the behaviour of the Hα, Hβ, and Hγ line profiles seen in FEROS spectra with the orbital phase. The REOSC spectra, taken almost at the same orbital phase, exhibit the same response (right panel). The Balmer lines change their intensity and widths with the orbital phase, being wider between phases 0.72 and 0.81. Close to the quadrature phases (0.24 and 0.75), the blue emission component fades and develops an extended wing. The relative intensity of the absorption and emission components also changes along the orbital motion; the lowest intensity is observed between ϕ = 0.24 and ϕ = 0.45. A weakness in the intensity of the P Cygni emission is also found in the B&C spectrum taken at ϕ = 0.37.
(b) He I lines: The line of He I λ4471 Å is highly contaminated by metallic lines from the F-type star (see Fig. 1). In contrast, the He I λ5875 Å and He I λ6678 Å lines display clear P Cygni profiles (see Fig. 10, top panel). The P Cygni profiles also change significantly with the orbital phase. At ϕ = 0.45, the absorption component is deeper and wider than in other phases. The absorption core is blue-shifted with barycentric velocities ranging from −182 km s−1 to −235 km s−1. At ϕ = 0.72, we estimate an RV of −366 km s−1 at the blue edge of the P Cygni absorption line, corrected by the barycentric RV, which might be interpreted as due to an outflowing polar wind. The IR He I line at 2.05 µm (bottom panel of Fig. 10) also shows a broad P Cygni profile with velocities of about −162 km s−1 and −378 km s−1 for the core of the P Cygni absorption component and the blue-shifted edge, respectively.
(c) Na I, Ca I, Ca II, and Mg II lines: The D1 and D2 Na I lines also show changes with the orbital phase (see Fig. 11, left panel). P Cygni-type profiles are present between phases 0.45 and 0.72, with blue extended wings. Line absorption components with velocities of −20 km s−1, −24 km s−1, −135 km s−1, and −149 km s−1 are present. An inverse P Cygni feature is noted at ϕ = 0.24. We also notice that the profiles of Na I D-lines exhibit short-term variations, both in intensity and shape.
The Ca II triplet is also seen in emission and displays variation with the orbital phase. The Fig. 11 (second panel) shows intensity and shape variations of the line Ca II λ8498 Å. At phase ϕ = 0.45, the line shows a double-peaked emission with a separation of −57 km s−1. Instead, the Ca I lines are in absorption (middle panels). They show RV and intensity changes with the orbital motion of the F-type star. The K-band spectrum, shown in Fig. 12, displays broad and weak emission lines of Na I λλ2.206, 2.209 µm (right panel) and Mg II λλ2.137, 2.144 µm (left panel), the former showing a double-peaked profile. The absorption features seen in the figure belong to the cool star.
(d) Fe II lines: The Fe II lines (λλ5991, 6084 Å) from multiplet 46 are observed in emission (see right panels of Fig. 11). The RV variations of some lines follow the motion of the gaseous envelope around the hot component. Other lines show RVs close to the barycentric RV of the system. The former is probably formed in the inner region of the accretion disc around the primary star. The low RVs observed in the other Fe II lines suggest a circumbinary origin. Forbidden lines of Fe II are absent.
(e) The CO band emission: The CO first-overtone bands arise in the K band at wavelengths longer than 2.293 µm. The entire band structure has been observed with IGRINS, whereas the observations with Phoenix and CRIRES covered only portions around the first and second band heads (see Table 2). The second-overtone bands that arise in the H band in the wavelength region 1.555–1.680 µm are covered by the IGRINS spectrum.
To analyse the CO band emission, we focus first on the IGRINS K-band spectrum, shown in Fig. 13. Its wide wavelength coverage, up to 2.45 µm, encompasses five band heads of 12CO and four band heads of 13CO, which is essential to constrain the physical parameters of the molecular gas precisely. The high resolution of the spectrum allows for identification of individual ro-vibrational transitions, especially bluewards of the second band head. These lines display double-peaked profiles, which indicate rotational broadening, in agreement with the findings of Wheelwright et al. (2012b) that the disc harbouring the CO gas revolves around the binary system on Keplerian orbits. Furthermore, Wheelwright et al. (2012a) detected the presence of 13CO based on their low-resolution AMBER data.
We used the code of Kraus et al. (2000), developed to compute 12CO band emission from a Keplerian rotating disc under LTE conditions. This code has been extended by Kraus (2009) and Oksala et al. (2013) to include emissions from the isotopic molecule 13CO. We implemented updated values for the energy levels and Einstein transition coefficients from Li et al. (2015). This update was also necessary to compute the CO emission of the second overtone bands arising in the H band precisely.
Kraus (2009) also showed that the CO molecular band emission intensity increases with both the temperature and column density. Therefore, the observed emission typically traces the hottest and densest region, which can be identified as the inner rim of the CO molecular disc. Under such conditions, the assumption of LTE is well justified, and it also allows us to restrict our calculations to a single ring of gas with constant temperature and column density.
The CO parameters of the best-fitting model to the IGRINS spectrum are given in Table 6. For the computation of the rotational velocity, we adopted a ring inclination angle of 48.5◦ (Wheelwright et al. 2012a). The model spectra are shown to facilitate comparison with the IGRINS observations in the K band (Fig. 13) and H band (Fig. 14). The latter is very faint and significantly blended with the intense photospheric H I absorption lines of the cool companion. From our model, we also found considerable enrichment of the molecular gas with 13CO, in agreement with its origin from the surface of an evolved star.
In addition, we reanalysed the CO spectra taken with CRIRES in 2010. Both Wheelwright et al. (2012b) and Maravelias et al. (2018) studied only the first-overtone CO band head arising in the spectral range 2.276–2.326 µm. From this, one can only derive the kinematics of the CO gas with high accuracy, but not the other parameters (temperature and column density). However, the CRIRES spectra cover four individual short wavelength portions, three of them located in regions of the CO band emission (as shown in the second panel of Fig. 15 with a black solid line). We found that the same parameters that fit the IGRINS spectrum also reproduce the CRIRES spectral pieces very well (shown in red solid line in Fig. 15) despite the time difference of more than eleven years between the two datasets and their different orbital phases.
The situation changes when inspecting the two sets of Phoenix spectra, one taken at orbital phase 0.81 in 2017 (third panel in Fig. 15) and the other one taken at phase ϕ = 0.12 in 2010 (fourth panel). These two spectra cannot fit equally well with the CO model (shown in red lines that were added just for comparison purposes). The most striking difference is that the entire observed emission is more intense in phase 0.81. In addition, the individually resolved lines display asymmetric line profiles with the red peak more intense than the blue one. At phase 0.12, it seems to be the opposite. The CO band emission is less intense, and the individual line profiles have a slightly higher blue peak. Unfortunately, at this phase, the first band head was not observed. Still, the difference with the other observational sets is obvious, as can also be seen more clearly in Fig. 16, where we compare the shape and intensity of the second band head observed at different orbital phases. Noteworthy, the strongest deviations in the spectrum are seen at phases 0.81 and 0.12, which mark more or less the beginning and the end of the broad minimum in the light curve, which might suggest that the late-type star hides part of the CO ring.
Finally, it is important to stress that the RV values derived from the CO band heads are between –8 km s−1 and 3 km s−1 relative to the barycentre of the system. Notably, the IGRINS spectra were taken at the orbital phase ϕ = 0.57, confirming that the ring of molecular gas is circumbinary.
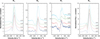 |
Fig. 9 Spectra from FEROS showing changes in the Hα (first panel), Hβ (second panel), and Hγ (third panel) lines with the orbital phase. Variations of the Hα line were observed with REOSC (fourth panel). Spectra have been shifted vertically to facilitate comparison. |
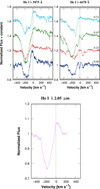 |
Fig. 10 Helium line profiles. Top panel: variations of the He I lines (taken with FEROS) with the orbital phase. Spectra have been shifted vertically to facilitate comparison. Bottom panel: infrared line of He I λ2.05 µm observed with IGRINS at the orbital phase ϕ = 0.57. |
Model parameters for the CO ring.
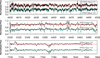 |
Fig. 11 Line variations with the orbital phase. Left panels: Na I D1 and D2 lines and Ca II λ8498 Å line. Middle panels: Ca I lines. Right panels: Fe II (46). These lines trace the motion of the hot component. Spectra have been shifted vertically to facilitate comparison. |
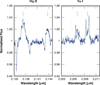 |
Fig. 12 Emission lines of Mg II and Na I observed in the K-band spectrum. The absorption features belong to the cool star. |
4.5 VLTI/MIDI
Figure 17 displays the MIDI visibility curves of HD 327083 for the three selected baselines and the given set of position angles in the sky. The visibility curves are almost flat, with values near 0.8. The error bars denote the total calibration uncertainty, including both random and systematic errors. We also calculated the full width half maximum (FWHM) from the observed visibility curves, assuming a 1−D Gaussian model for the envelope intensity distribution (Leinert et al. 2004), as shown in Fig. 18. The FWHM grows steadily with increasing wavelength as expected, from about 5 mas around 8 µm to 15 mas for 13 µm, depending on the baseline. These observations were performed at the orbital phases 0.19, 0.2 and 0.46. This result suggests an elongated dust distribution.
Nevertheless, MIDI spectral fluxes reveal a conspicuous broad and deep absorption feature that peaks at 9.7 µm attributed to stretching modes of Si-O bonds in amorphous silicates (Roche & Aitken 1984), shown with red symbols in Fig. 19. This figure displays the mean calibrated MIDI fluxes (with error bars between 10% and 20% of their corresponding fluxes) combined with Spitzer data (black symbols). The presence of this absorption feature is also confirmed by the absence of an increase of the FWHM around 10 µm, as seen in Fig. 18.
5 Discussion
To study the binary system and its evolutionary status, we carried out and analysed high-spectral and spatial resolution observations of HD 327083, from optical to mid-IR ranges. We also derived the physical and chemical properties of the gaseous and dust discs surrounding the primary and the entire binary system.
Furthermore, we improved the orbital parameters by combining our RV measurements with those obtained by Miroshnichenko et al. (2003). We found an orbital period of P = 107.699 days, already reported in Maravelias et al. (2018), which provides a perfect phase-folded light curve when applied to the ASAS-3 observations. In addition, we found that the system has a very low eccentricity, indicating that tidal circularisation is almost reached. In parallel with our work, Porter (2021) and Nodyarov et al. (2022, 2024) determined periods of 107.991 and 107.7 days, respectively. We derived a mass function for the system of 1.357, which is very similar to the 1.26 value found by Nodyarov et al. (2024).
5.1 Properties of the binary system
We found that the binary system encompasses an accreting B-type star (26 000 K, log g = 3.0) with a gaseous envelope and a cool giant of spectral type F6 (6750 K, log g = 2.0). A molecular disc and dust surround the binary system. The system is almost circularised. Due to the lack of photospheric absorption lines of the B-type star, we analysed its circumstellar gaseous disc that displays emission lines of Fe II. The RV curve based on these emission lines has almost the same amplitude as that of the late-type star (K2 ∼ K1). However, as the emission lines trace the dynamics of the star plus the disc, which is not necessarily circular, the mass of the hidden component may be comparable to or even exceed that of the late-type star.
The light curve of HD 327083 shows indications of tidal deformation, as described in Sect. 4.3. However, the spectrum of the cool companion agrees well with that of an F6 II–III star and appears typical for its spectral type. Therefore, the ‘deformation’ of the star corresponds to a close filling of the high-mass component’s Roche lobe and the onset of mass transfer (Vaidman et al. 2025, see also details in Sect. 5.3). The excess material that cannot be accreted efficiently is likely expelled over the poles of the hot companion. Such a scenario affects both the evolution of the binary orbit through the loss of mass and angular momentum, as well as the stellar components themselves.
To quantify the size of the Roche-lobe filling late-type star, we calculated the expected critical radius by applying Eggleton’s relationship (Eggleton 1983):
 (3)
where a = a1 + a2 is the distance between the two stars and
(3)
where a = a1 + a2 is the distance between the two stars and  is the mass fraction. To search for the best evolutionary model (see Sect. 5.3), we explored different values of M2, ranging from those corresponding to inclination angles of i = 90◦ (seen edge-on, Miroshnichenko et al. 2003) to i = 48.5◦ (Wheelwright et al. 2012b). The latter was derived from AMBER data for the CO disc. Furthermore, assuming the donor star is filling the Roche lobe (Eq. (3)), the stellar radii and bolometric magnitudes of each component are calculated. Table 7 lists possible values of
  (where
  ), a, and Mbol, as well as the minimum and maximum masses of the stellar components, for a given q and within the considered range of inclinations. We used Eq. (1) and the third Kepler’s law.
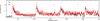 |
Fig. 13 Portion of the normalised IGRINS K-band spectrum covering the CO first-overtone bands (solid black line). The best-fitting CO model is shown in red. The tics indicate the positions of 12CO and 13CO band heads. |
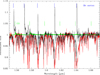 |
Fig. 14 Second-overtone bandheads of the CO molecule. The complex features seen in the spectrum (solid black line) combine the CO molecular emission pattern and the Brackett lines in absorption arising from the photosphere of the cool companion. A standard F-type star’s spectrum (solid red line) and the CO model (solid green line) are plotted to facilitate comparison. |
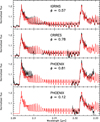 |
Fig. 15 Spectra of CO taken with various instruments at different orbital phases (black lines). For reference, the best-fitting model (red lines) to the IGRINS spectrum (top panel) is overplotted in all panels. A local density enhancement at ϕ = 0.81 can be observed as well as a change in the blue shoulder of the second CO band head at ϕ = 0.12. |
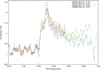 |
Fig. 16 Variation in the intensity and shape of the second CO band head with the orbital phase. |
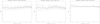 |
Fig. 17 VLTI/MIDI visibility curves for HD 327083 during April–May 2010. The curves are almost flat, with values near 0.8. |
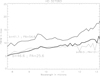 |
Fig. 18 VLTI/MIDI Gaussian fits for each visibility curve as a function of wavelength. The extent of the dust regions varies with wavelength. |
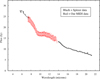 |
Fig. 19 Comparison between the MIDI spectral fluxes of HD 327083 (in red) with Spitzer archive data (in black). The amorphous silicate feature at 9.7 µm is seen in absorption. |
5.2 The circumbinary environment
The near and mid-IR spectrum reveals an O-rich environment. Both near-IR CO and SiO molecular features are in emission, while dust silicate features are in absorption. From fitting the CO emission, we confirmed that the molecular ring is formed by material ejected by the evolved star since it presents 13CO enrichment. The RVs of the CO band heads indicate that the molecular gas is circumbinary.
Wheelwright et al. (2012b) estimated a size of approximately 3 ± 0.3 AU (adopting a distance of 1.5 kpc) for the inner edge of this circumbinary ring, which is far beyond the orbits of the two components. However, using the updated Gaia distance of 2.448 ± 0.145 kpc, this location is revised, and a larger value of 4.89 ± 1.73 AU is obtained.
We found that the CO ring is stable over the observing period of eleven years. However, contrary to Wheelwright et al. (2012b)’s results, we report here evidence for CO variability on short timescales (within one month, see Figs. 15 and 16). The rotationally broadened ro-vibrational CO lines obtained with CRIRES (ϕ = 0.78) display profiles with slightly more pronounced red peaks than the blue ones. This situation appears to be the opposite one month later (at the orbital phase ϕ = 0.12) when the 2010 Phoenix spectrum (despite being a little bit noisier) shows a much stronger blue peak (shown in Fig. 15, bottom panel, and in Fig. 16 with orange line). The blue shoulder of the second band head arises from the superposition of many individual ro-vibrational lines, all having an asymmetric line profile with the blue peak more intense than the red one, which easily accounts for the difference in shape. As these phases coincide with the beginning and end of the broad minimum in the light curve, the late-type star might also hide parts of the CO ring. Moreover, at ϕ = 0.81, the 2017 Phoenix spectrum reveals a higher CO intensity relative to the continuum, which might be interpreted with a change in continuum contribution.
Furthermore, MIDI spectroscopy detected the presence of a deep silicate absorption feature. Stellar objects with deep silicate absorption features are rarely observed since silicate is primarily seen in emission from warm circumstellar dust surrounding oxygen-rich stars (Mathis 1990). In addition, polycyclic aromatic hydrocarbon (PAH) features at 8.6 and 11.3 µm are not observed (see Fig. 19).
The VLTI/MIDI visibility curves are flat, with values close to 0.8, and the observed FWHM values increase with wavelength.
Such behaviour was also reported in the B[e] supergiant CPD-57◦ 2874 (Domiciano de Souza et al. 2007), which suggested that the dust continuum emission originates from an elongated structure. For HD 327083, the inner size of the dusty region extends from 12.5 AU (5 mas for 8 µm) to 29.4 AU (12 mas for 13 µm) at ϕ = 0.19–0.20 and from 22.5 AU (9 mas for 8 µm) to 44 AU (18 mas for 13 µm) at ϕ = 0.47, assuming the Gaia distance. This result confirms that the dust structure is elongated (likely elliptical) and circumbinary and is therefore located in the CO ring’s outer regions. The extent of the dust regions agrees with the hot dust shells used to fit the SED (see Fig. 4).
Binary system parameters for two orbital inclinations.
5.3 The nature of HD 327083
The temperature of the B-type object is high enough (26 000 K) to ionise the environment embedding the star, which becomes detectable by emission lines. While the optical line spectrum and near-IR colours of HD 327083 suggest an early-type supergiant with emission lines, the hydrogen Pfund series is not seen in emission. This puts the star apart from all other B[e]SGs we had studied (see, e.g. Kraus et al. 2013; Oksala et al. 2013), where so far usually Pfund and CO band emissions appear simultaneously.
We calculated an absolute magnitude of the system to be MV = −7.5 mag, using the apparent magnitude mV = 9.8 mag, the Gaia distance (d = 2.45 kpc), and the obtained ISM E(B – V) = 1.4 mag and an extra absorption of ∼1 mag due to the gaseous and dust shells. According to Eq. (3), the expected bolo-metric magnitude for an F-type star with Teff = 6750 K that fills its Roche lobe is between Mbol = −5.5 mag and −6.1 mag (see Table 7, for q ∼ 1). The table lists two different inclination angles, while the magnitude range reflects the upper-limit cases. Then, the Mbol of the hot companion is between −7.3 mag and −7.9 mag, assuming that its radius is 0.14 R1 (where  ). We used the code BSE (Tout et al. 1997) that describes the evolution of a binary system, considering mass loss, mass transfer, and common-envelope evolution. We explored several combinations of q values, using the solution of M1 for different inclinations (from i = 90◦ to i = 48.5◦, see Eq. (2)). There are only a few models that fit the observed effective temperature, the expected luminosity, and the separation between the components. The most plausible evolutionary model corresponds to an interacting binary with similar initial masses, that is 13.2 M⊙ and 12.9 M⊙. The system underwent an extended phase of mass transfer, and after approximately 15.4 Myr, it evolved to the observed orbital configuration with current masses of M1 = 12.9 M⊙ and M2 = 12.7 M⊙. This solution agrees with an inclination angle of 48.5◦ for the orbital plane relative to the observer’s line of sight. However, to fulfil the condition of the surface gravity of log g = 2.0 for the cool component, as was derived from plane-parallel models of stellar atmosphere, the Roche lobe should be filled only up to some 60–70% compared to the case of a complete Roche lobe filling (see Table 7, case q = 1 and an inclination angle of 48.5◦). Whether the accretion disc of the hot star is fed by direct mass transfer from the cool star or via accretion from the circumbinary disc is not yet constrained.
Alternatively, using the Keplerian rotation velocity of the CO disc of 75 ± 1 km s−1 and its radius of 4.89 ± 1.73 AU, we estimate the central mass of the system of about 31 ± 11 M⊙. This value also agrees with the total mass found from the evolutionary model of the binary system (∼26 M⊙).
The BSE code also provides details about the various evolutionary stages of our binary system. At 15.42 Myr, the F-type star expands, initiating a Roche-lobe overflow (RLOF). The mass transfer likely continues as the star further expands within its lobe. This stage is our actual scenario. Shortly after, the system will enter a blue straggler star phase, where the mass gainer rejuvenates and appears hotter and more massive than expected for its age, accompanied by a significant change in stellar mass. At approximately 15.43 Myr, a common envelope phase would begin. During this stage, the system undergoes a rapid orbital tightening while ejecting a large amount of mass. By 16.4 Myr, the hot companion will evolve and begin its own RLOF and common envelope phase. The system will likely end in a supernova explosion.
An alternative model of evolution was computed by Vaidman et al. (2025) using the Mesa code, who derived a current system age of 13.6 ± 0.1 Myr. This solution leads to a massive binary system (with M1 = 13 M⊙ and 11.50 M⊙). The state of the system corresponds to a close filling of the high-massive component’s Roche lobe and the beginning of the mass transfer. After the mass transfer event, the mass of the post-primary drops to 5 M⊙, the post-secondary mass grows until 20 M⊙, and the binary will convert to a detached system with a long orbital period of ∼700 days.
In the context of our evolutionary configuration, the formation of the circumbinary discs of CO and silicate dust takes place as a consequence of the mass transfer process and during the filling of the Roche lobe of the primary star (F-type) through the outer Lagrangian point L2 (e.g. Shu et al. 1979; Pejcha et al. 2016). Such binaries are supposed to be circularised. Although the F-type star does not host CO in its atmosphere, molecules can form in the surrounding environment once the temperature drops below 5000 K. The observed isotopic CO ratio of only 20 can be achieved during the pre-red supergiant phase in rotating stars (Kraus et al. 2025).
6 Conclusions
We have presented new multi-epoch high-resolution optical and near-infrared spectra of the putative B[e] supergiant HD 327083 along with photometric data taken over a time of about ten years. The spectra are dominated by absorption lines from the late-type companion (F6 II-III) and pure emission lines as well as lines with P Cygni profiles connected with a hot star. The emission lines can be interpreted as arising from a dense environment, most likely an accretion disc, in which the hot companion is embedded, and the P Cygni profiles trace a bi-polar wind emanating from it. This conclusion is based on the shape of the light curve, which further suggests that the late-type star is tidally deformed and most likely underfilling its Roche lobe. Furthermore, the circumbinary molecular ring (also tilted at 48.5◦, Wheelwright et al. 2012a) is partially blocked by the F-type star at some orbital phases, leading to asymmetric line profiles. This circumbinary ring is most likely a consequence of mass transfer during the RLOF phase through the Lagrangian point L2. Due to tidal variations, we expect the circumbinary disc to precess and the binary system orbit to have a non-zero eccentricity. Unfortunately, we do not have good coverage of the CO emission over the complete orbit of the binary system in order to fully describe the temporal evolution of the circumbinary ring.
The VLTI/MIDI visibility curves indicate that the dust continuum emission originates from an elongated circumbinary structure located in the CO ring’s outer regions. In addition, our MIDI spectrum reveals a strong absorption band of amorphous silicates, which is often seen in oxygen-rich stars. Follow-up interferometric observations over the orbital period are clearly needed to confirm the observed variable distance of the inner disc rim with the orbital phase and to unveil its nature.
Our analysis of the radial velocities of numerous lines resulted in a refined orbital solution of the B[e] binary system. We derived a period of P = 107.699 d, in agreement with Nodyarov et al. (2024)’s results. In addition, the emission lines exhibit variations in both shape and intensity throughout the orbital period, likely caused by attenuation from the gas stream. Furthermore, we found that both stars have similar masses of 12.9 M⊙, and the system has a separation of 1.3 AU.
From our analysis, we conclude that the B[e] binary system HD 327083 is nearly circularised and would be made up of stars of similar masses (a supergiant of 26 000 K, early B type) and a Roche lobe partially filled by the F-type companion that is probably evolving towards the red supergiant stage.
Acknowledgements
We would like to thank the referee for carefully reviewing our manuscript and providing thoughtful and constructive comments. This work is based on observations taken with 1) Telescopes at Paranal ESO Observatory under the program 085.D − 0454 for CRIRES, and 085.D − 0454(B) for MIDI; 2) The MPG/ESO 2.2-m telescope and the ESO 1.52-m telescope under programs 385.D − 0513(A), 075.D − 0177(A), 082.A − 9209(A), 085.D − 0185(A), 094.A − 9029(D), 095.A − 9032(A), 096.A − 9024(A), 096.A − 9030(A), 096.A − 9039(A), 097.A − 9024(A) and 097.A − 9039(C) for FEROS; 3) Gemini South/Phoenix instrument, science program GS − 2010A − Q − 41, GS − 2017A − Q − 30 and GS − 2021A − Q − 401; 4) J. Sahade Telescope at Complejo Astronómico El Leoncito (CASLEO), operated under an agreement between the Consejo Nacional de Investigaciones Científicas y Técnicas de la República Argentina, the Secretaría de Ciencia y Tecnología de la Nación and the National Universities of La Plata, Córdoba and San Juan; 5) The Observatório do Pico dos Dias, LNA, Brazil. The work also used the Immersion Grating Infrared Spectrometer (IGRINS) that was developed under a collaboration between the University of Texas at Austin and the Korea Astronomy and Space Science Institute (KASI) with the financial support of the US National Science Foundation 27 under grants AST-1229522 and AST-1702267, of the University of Texas at Austin, and of the Korean GMT Project of KASI. The FEROS observations obtained between 2014 and 2017 with the MPG 2.2 m telescope were supported by the Ministry of Education, Youth and Sports project – LG14013 (Tycho Brahe: Supporting Ground-based Astronomical Observations). We want to thank the observers (S. Ehlerova, A. Kawka, and L. Zychova) for obtaining the data. In addition, this research was achieved using the POLLUX database (http://pollux.oreme.org/), operated at LUPM (Université de Montpellier – CNRS, France) with the support of the PNPS and INSU. This work is also based in part on observations made with the Spitzer Space Telescope, which was operated by the Jet Propulsion Laboratory, California Institute of Technology under a contract with NASA. The Astronomical Institute in Ondřejov is supported by the project RVO:67985815. MLA and AFT acknowledge financial support from CONICET (PIP 1337) and the Universidad Nacional de La Plata (Programa de Incentivos 11/G160), Argentina. YJA thanks funding from the Uni-versidad Nacional de La Plata (Programa de Incentivos 11/G162), Argentina. MBF acknowledges financial support from the National Council for Scientific and Technological Development – CNPq – Brazil (grant number: 307711/2022-6). MC acknowledges the support from Centro de Astrofísica de Valparaíso, and MC and IA thank the support from the FONDECYT project 1230131. This project has received funding from the European Union’s Framework Programme for Research and Innovation Horizon 2020 (2014–2020) under the Marie Skłodowska-Curie grant agreement No. 823734 (POEMS) and HORIZON TMA MSCA Staff Exchanges grant agreement No. 101183150 (OCEANS).
References
- Beals, C. S. 1953, Publ. Dominion Astrophys. Observ. Victoria, 9, 1 [Google Scholar]
- Cardelli, J. A., Clayton, G. C., & Mathis, J. S. 1989, in IAU Symposium, Vol. 135, Interstellar Dust|, eds. L. J. Allamandola, & A. G. G. M. Tielens, 5 [Google Scholar]
- Carlson, E. D., & Henize, K. G. 1979, Vistas Astron., 23, 213 [Google Scholar]
- Castelli, F., & Kurucz, R. L. 2003, in Modelling of Stellar Atmospheres, 210, eds. N. Piskunov, W. W. Weiss, & D. F. Gray, A20 [NASA ADS] [Google Scholar]
- Chalonge, D., & Divan, L. 1973, A&A, 23, 69 [NASA ADS] [Google Scholar]
- Cidale, L. S., & Ringuelet, A. E. 1989, PASP, 101, 417 [NASA ADS] [CrossRef] [Google Scholar]
- Cidale, L. S., Borges Fernandes, M., Andruchow, I., et al. 2012, A&A, 548, A72 [NASA ADS] [CrossRef] [EDP Sciences] [Google Scholar]
- Curé, M., Rial, D. F., & Cidale, L. 2005, A&A, 437, 929 [NASA ADS] [CrossRef] [EDP Sciences] [Google Scholar]
- Cutri, R. M., Skrutskie, M. F., van Dyk, S., et al. 2003, VizieR Online Data Catalog: 2MASS All-Sky Catalog of Point Sources (Cutri+ 2003), VizieR On-line Data Catalog: II/246. Originally published in: University of Massachusetts and Infrared Processing and Analysis Center, (IPAC/California Institute of Technology) (2003) [Google Scholar]
- Cutri, R. M., Wright, E. L., Conrow, T., et al. 2012, Explanatory Supplement to the WISE All-Sky Data Release Products [Google Scholar]
- de Laverny, P., Recio-Blanco, A., Worley, C. C., & Plez, B. 2012, A&A, 544, A126 [NASA ADS] [CrossRef] [EDP Sciences] [Google Scholar]
- Domiciano de Souza, A., Driebe, T., Chesneau, O., et al. 2007, A&A, 464, 81 [NASA ADS] [CrossRef] [EDP Sciences] [Google Scholar]
- Egan, M. P., Price, S. D., & Kraemer, K. E. 2003, in American Astronomical Society Meeting Abstracts, 203, 57.08 [NASA ADS] [Google Scholar]
- Eggleton, P. P. 1983, ApJ, 268, 368 [Google Scholar]
- Gaia Collaboration. 2020, VizieR Online Data Catalog: Gaia EDR3 (Gaia Collaboration, 2020), VizieR On-line Data Catalog: I/350. Originally published in: 2021A & A…649A…1G [Google Scholar]
- Hamuy, M., Suntzeff, N. B., Heathcote, S. R., et al. 1994, PASP, 106, 566 [NASA ADS] [CrossRef] [Google Scholar]
- Henize, K. G. 1952, ApJ, 115, 133 [Google Scholar]
- Hinkle, K. H., Cuberly, R. W., Gaughan, N. A., et al. 1998, SPIE Conf. Ser., 3354, 810 [NASA ADS] [Google Scholar]
- Hinkle, K. H., Blum, R. D., Joyce, R. R., et al. 2003, SPIE Conf. Ser., 4834, 353 [NASA ADS] [Google Scholar]
- Ishihara, D., Onaka, T., Kataza, H., et al. 2010, A&A, 514, A1 [NASA ADS] [CrossRef] [EDP Sciences] [Google Scholar]
- Jaffe, W. J. 2004, SPIE Conf. Ser., 5491, 715 [Google Scholar]
- Kaufer, A., Stahl, O., Tubbesing, S., et al. 1999, The Messenger, 95, 8 [Google Scholar]
- Kaeufl, H.-U., Ballester, P., Biereichel, P., et al. 2004, SPIE Conf. Ser., 5492, 1218 [NASA ADS] [Google Scholar]
- Kozok, J. R. 1985a, A&AS, 62, 7 [Google Scholar]
- Kozok, J. R. 1985b, A&AS, 61, 387 [Google Scholar]
- Kraus, M. 2009, A&A, 494, 253 [NASA ADS] [CrossRef] [EDP Sciences] [Google Scholar]
- Kraus, M. 2019, Galaxies, 7, 83 [NASA ADS] [CrossRef] [Google Scholar]
- Kraus, M., Krügel, E., Thum, C., & Geballe, T. R. 2000, A&A, 362, 158 [NASA ADS] [Google Scholar]
- Kraus, M., Borges Fernandes, M., & de Araújo, F. X. 2007, A&A, 463, 627 [NASA ADS] [CrossRef] [EDP Sciences] [Google Scholar]
- Kraus, M., Borges Fernandes, M., Kubát, J., & de Araújo, F. X. 2008, A&A, 487, 697 [NASA ADS] [CrossRef] [EDP Sciences] [Google Scholar]
- Kraus, S., Calvet, N., Hartmann, L., et al. 2012, ApJ, 746, L2 [NASA ADS] [CrossRef] [Google Scholar]
- Kraus, M., Oksala, M. E., Nickeler, D. H., et al. 2013, A&A, 549, A28 [NASA ADS] [CrossRef] [EDP Sciences] [Google Scholar]
- Kraus, M., Oksala, M. E., Cidale, L. S., et al. 2015, ApJ, 800, L20 [Google Scholar]
- Kraus, M., Cidale, L. S., Arias, M. L., et al. 2016, A&A, 593, A112 [NASA ADS] [CrossRef] [EDP Sciences] [Google Scholar]
- Kraus, M., Arias, M. L., Kourniotis, M., et al. 2025, MNRAS, 541, 4049 [Google Scholar]
- Lamers, H. J. G. L. M., & Cassinelli, J. P. 1999, Introduction to Stellar Winds [Google Scholar]
- Lamers, H. J. G. L. M., Zickgraf, F.-J., de Winter, D., Houziaux, L., & Zorec, J. 1998, A&A, 340, 117 [NASA ADS] [Google Scholar]
- Langer, N., & Heger, A. 1998, in Astrophysics and Space Science Library, 233, B[e] stars, eds. A. M. Hubert, & C. Jaschek, 235 [Google Scholar]
- Leinert, C., van Boekel, R., Waters, L. B. F. M., et al. 2004, A&A, 423, 537 [NASA ADS] [CrossRef] [EDP Sciences] [Google Scholar]
- Lenz, P., & Breger, M. 2014, Period04: Statistical analysis of large astronomical time series, Astrophysics Source Code Library [record ascl:1407.009] [Google Scholar]
- Li, G., Gordon, I. E., Rothman, L. S., et al. 2015, ApJS, 216, 15 [NASA ADS] [CrossRef] [Google Scholar]
- Lopes, D. F., Damineli Neto, A., & de Freitas Pacheco, J. A. 1992, A&A, 261, 482 [NASA ADS] [Google Scholar]
- Machado, M. A. D., de Araújo, F. X., & Lorenz-Martins, S. 2001, A&A, 368, L29 [NASA ADS] [CrossRef] [EDP Sciences] [Google Scholar]
- Maravelias, G., Kraus, M., Cidale, L. S., et al. 2018, MNRAS, 480, 320 [CrossRef] [Google Scholar]
- Marchiano, P., Brandi, E., Muratore, M. F., et al. 2012, A&A, 540, A91 [NASA ADS] [CrossRef] [EDP Sciences] [Google Scholar]
- Marton, G., Gezer, I., Madarász, M., et al. 2024, A&A, 688, A203 [NASA ADS] [CrossRef] [EDP Sciences] [Google Scholar]
- Mathis, J. S. 1990, ARA&A, 28, 37 [Google Scholar]
- McGregor, P. J., Hyland, A. R., & Hillier, D. J. 1988, ApJ, 324, 1071 [NASA ADS] [CrossRef] [Google Scholar]
- Miroshnichenko, A. S., Levato, H., Bjorkman, K. S., & Grosso, M. 2003, A&A, 406, 673 [NASA ADS] [CrossRef] [EDP Sciences] [Google Scholar]
- Moujtahid, A., Zorec, J., & Hubert, A. M. 1999, A&A, 349, 151 [NASA ADS] [Google Scholar]
- Muratore, M. F., Cidale, L. S., Arias, M. L., Zorec, J., & Torres, A. F. 2011, in IAU Symposium, Vol. 272, Active OB Stars: Structure, Evolution, Mass Loss, and Critical Limits, eds. C. Neiner, G. Wade, G. Meynet, & G. Peters, 620 [Google Scholar]
- Nodyarov, A. S., Miroshnichenko, A. S., Khokhlov, S. A., et al. 2022, Odessa Astron. Publ., 35, 62 [Google Scholar]
- Nodyarov, A. S., Miroshnichenko, A. S., Khokhlov, S. A., et al. 2024, ApJ, 968, 52 [Google Scholar]
- Oksala, M. E., Kraus, M., Cidale, L. S., Muratore, M. F., & Borges Fernandes, M. 2013, A&A, 558, A17 [NASA ADS] [CrossRef] [EDP Sciences] [Google Scholar]
- Olnon, F. M., Raimond, E., Neugebauer, G., et al. 1986, A&AS, 65, 607 [Google Scholar]
- Palacios, A., Gebran, M., Josselin, E., et al. 2010, A&A, 516, A13 [NASA ADS] [CrossRef] [EDP Sciences] [Google Scholar]
- Park, C., Jaffe, D. T., Yuk, I.-S., et al. 2014, SPIE Conf. Ser., 9147, 91471D [NASA ADS] [Google Scholar]
- Pejcha, O., Metzger, B. D., & Tomida, K. 2016, MNRAS, 461, 2527 [NASA ADS] [CrossRef] [Google Scholar]
- Podsiadlowski, P., Morris, T. S., & Ivanova, N. 2006, in Astronomical Society of the Pacific Conference Series, 355, Stars with the B[e] Phenomenon, ed. M. Kraus & A. S. Miroshnichenko, 259 [NASA ADS] [Google Scholar]
- Pojmanski, G. 1997, Acta Astron., 47, 467 [Google Scholar]
- Porter, A. 2021, PhD Thesis, Pembroke College, University of Oxford [Google Scholar]
- Roche, P. F., & Aitken, D. K. 1984, MNRAS, 208, 481 [NASA ADS] [Google Scholar]
- Shu, F. H., Lubow, S. H., & Anderson, L. 1979, ApJ, 229, 223 [NASA ADS] [CrossRef] [Google Scholar]
- Torres, A. F., Cidale, L. S., Kraus, M., et al. 2018, A&A, 612, A113 [EDP Sciences] [Google Scholar]
- Tout, C. A., Aarseth, S. J., Pols, O. R., & Eggleton, P. P. 1997, MNRAS, 291, 732 [NASA ADS] [Google Scholar]
- Vaidman, N. L., Miroshnichenko, A. S., Zharikov, S. V., et al. 2025, Galaxies, 13, 47 [Google Scholar]
- Wang, Y., Weigelt, G., Kreplin, A., et al. 2012, A&A, 545, L10 [NASA ADS] [CrossRef] [EDP Sciences] [Google Scholar]
- Wheelwright, H. E., de Wit, W. J., Oudmaijer, R. D., & Vink, J. S. 2012a, A&A, 538, A6 [NASA ADS] [CrossRef] [EDP Sciences] [Google Scholar]
- Wheelwright, H. E., de Wit, W. J., Weigelt, G., Oudmaijer, R. D., & Ilee, J. D. 2012b, A&A, 543, A77 [NASA ADS] [CrossRef] [EDP Sciences] [Google Scholar]
- Whitelock, P. A., Feast, M. W., Roberts, G., Carter, B. S., & Catchpole, R. M. 1983, MNRAS, 205, 1207 [NASA ADS] [Google Scholar]
- Zickgraf, F.-J., Wolf, B., Stahl, O., Leitherer, C., & Klare, G. 1985, A&A, 143, 421 [NASA ADS] [Google Scholar]
- Zorec, J. 1998, in Astrophysics and Space Science Library, 233, B[e] stars, eds. A. M. Hubert, & C. Jaschek, 27 [Google Scholar]
- Zorec, J. 2023, Galaxies, 11, 54 [NASA ADS] [CrossRef] [Google Scholar]
- Zorec, J., Cidale, L., Arias, M. L., et al. 2009, A&A, 501, 297 [NASA ADS] [CrossRef] [EDP Sciences] [Google Scholar]
IRAF is distributed by the National Optical Astronomy Observatory, which is operated by the Association of Universities for Research in Astronomy (AURA) under a cooperative agreement with the National Science Foundation.
The angular diameter, θUD, was obtained from the calibrators list provided by MIA+EWS data reduction package and the flux, F12, at the [12] band was taken from Cidale et al. (2012).
The flux Fλ if given in erg cm−2 s−1 Å−1.
All Tables
All Figures
|
Fig. 1 Spectrum from FEROS of HD 327083 taken on 2017, August 26 (solid black line) compared with MARCS atmospheric models of 6600–6750 K for log g = 2.0 and log g = 3.5 (solid green and red lines, respectively). This region is dominated by photospheric lines (of H I and metals) from a late F-type star. The emission lines are formed in the disc of the hot companion: He I (P Cygni profiles), Hα, and Fe II lines. |
| In the text | |
|
Fig. 2 Portion of the IGRINS H-band spectrum. This region is dominated by photospheric lines (of H I and metals) from an F-type star. Emission lines with P Cygni profiles correspond to H I (indicated with ticks) and Fe II (seen in the 1.687–1.690 µm region). These lines are formed in the disc around the B-type companion. For comparison purposes, an F5 III star is overplotted (shown in red). |
| In the text | |
|
Fig. 3 Low-resolution optical spectrum at different phases showing variation in the line intensity and the Balmer continuum. |
| In the text | |
|
Fig. 4 Spectral energy distribution and the best-fitting model (in solid red line, see details in the text). Photometric data were taken from Kozok (1985b); Cutri et al. (2003); Egan et al. (2003); Miroshnichenko et al. (2003); Ishihara et al. (2010); Cutri et al. (2012); Gaia Collaboration (2020); Marton et al. (2024). The Spitzer and IUE spectra were taken from their corresponding archives. |
| In the text | |
|
Fig. 5 Radial velocity curve and ASAS-3 light curve. Top panel: best-fitting RV curve (phase diagram) obtained with a period of 107.699 days using our data (red symbols) and those published by Miroshnichenko et al. (2003, blue symbols). Circle symbols follow the orbital motion of the F-type star (photospheric lines), and asterisks are for Fe II emission lines. The horizontal line indicates the barycentric RV of the system, γ0 = −29 km s−1. Bottom panel: ASAS-3 light curve as a function of the orbital phase (see details in section 4.3). The zero phase was calculated using the epoch Tc, when the cool component is located between the observer and the hot component. |
| In the text | |
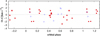 |
Fig. 6 Residuals of the RV curve. The symbol description is the same as Fig. 5. |
| In the text | |
|
Fig. 7 Periodogram of the ASAS-3 light curve showing two dominant frequencies, F1 = 0.0092772 d−1 (P = 107.79 d) and F2 = 0.018579 d−1 (53.82 d). |
| In the text | |
|
Fig. 8 Optical and near-IR H lines. Left panel: line profiles of Hα, Hβ, and Hγ at ϕ = 0.08. Right panel: P Cygni profile of the Brγ line at ϕ = 0.57. |
| In the text | |
|
Fig. 9 Spectra from FEROS showing changes in the Hα (first panel), Hβ (second panel), and Hγ (third panel) lines with the orbital phase. Variations of the Hα line were observed with REOSC (fourth panel). Spectra have been shifted vertically to facilitate comparison. |
| In the text | |
|
Fig. 10 Helium line profiles. Top panel: variations of the He I lines (taken with FEROS) with the orbital phase. Spectra have been shifted vertically to facilitate comparison. Bottom panel: infrared line of He I λ2.05 µm observed with IGRINS at the orbital phase ϕ = 0.57. |
| In the text | |
|
Fig. 11 Line variations with the orbital phase. Left panels: Na I D1 and D2 lines and Ca II λ8498 Å line. Middle panels: Ca I lines. Right panels: Fe II (46). These lines trace the motion of the hot component. Spectra have been shifted vertically to facilitate comparison. |
| In the text | |
|
Fig. 12 Emission lines of Mg II and Na I observed in the K-band spectrum. The absorption features belong to the cool star. |
| In the text | |
|
Fig. 13 Portion of the normalised IGRINS K-band spectrum covering the CO first-overtone bands (solid black line). The best-fitting CO model is shown in red. The tics indicate the positions of 12CO and 13CO band heads. |
| In the text | |
|
Fig. 14 Second-overtone bandheads of the CO molecule. The complex features seen in the spectrum (solid black line) combine the CO molecular emission pattern and the Brackett lines in absorption arising from the photosphere of the cool companion. A standard F-type star’s spectrum (solid red line) and the CO model (solid green line) are plotted to facilitate comparison. |
| In the text | |
|
Fig. 15 Spectra of CO taken with various instruments at different orbital phases (black lines). For reference, the best-fitting model (red lines) to the IGRINS spectrum (top panel) is overplotted in all panels. A local density enhancement at ϕ = 0.81 can be observed as well as a change in the blue shoulder of the second CO band head at ϕ = 0.12. |
| In the text | |
|
Fig. 16 Variation in the intensity and shape of the second CO band head with the orbital phase. |
| In the text | |
|
Fig. 17 VLTI/MIDI visibility curves for HD 327083 during April–May 2010. The curves are almost flat, with values near 0.8. |
| In the text | |
|
Fig. 18 VLTI/MIDI Gaussian fits for each visibility curve as a function of wavelength. The extent of the dust regions varies with wavelength. |
| In the text | |
|
Fig. 19 Comparison between the MIDI spectral fluxes of HD 327083 (in red) with Spitzer archive data (in black). The amorphous silicate feature at 9.7 µm is seen in absorption. |
| In the text | |
Current usage metrics show cumulative count of Article Views (full-text article views including HTML views, PDF and ePub downloads, according to the available data) and Abstracts Views on Vision4Press platform.
Data correspond to usage on the plateform after 2015. The current usage metrics is available 48-96 hours after online publication and is updated daily on week days.
Initial download of the metrics may take a while.