Fig. 5
Download original image
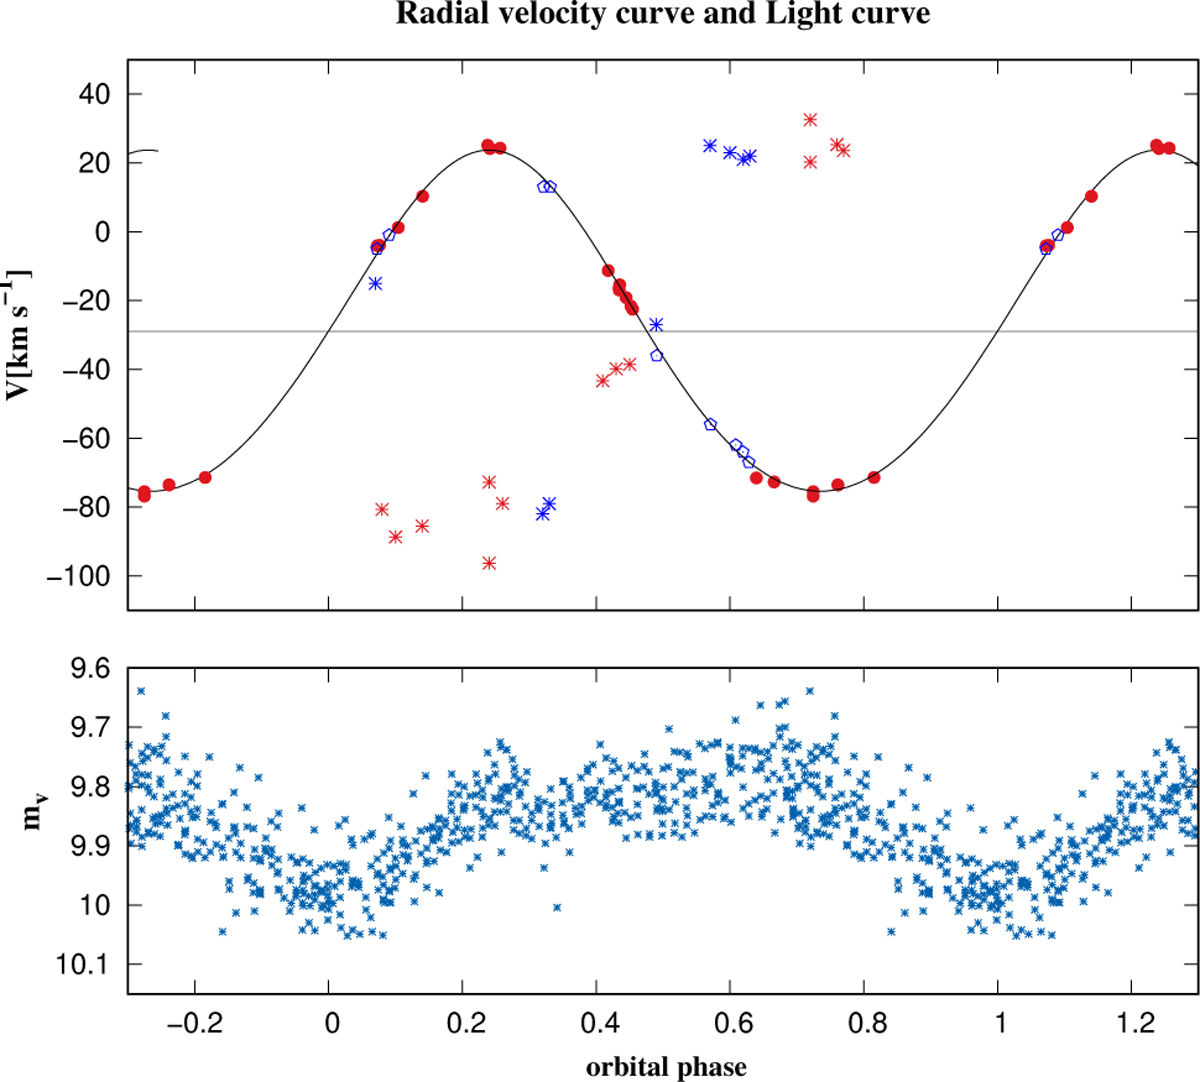
Radial velocity curve and ASAS-3 light curve. Top panel: best-fitting RV curve (phase diagram) obtained with a period of 107.699 days using our data (red symbols) and those published by Miroshnichenko et al. (2003, blue symbols). Circle symbols follow the orbital motion of the F-type star (photospheric lines), and asterisks are for Fe II emission lines. The horizontal line indicates the barycentric RV of the system, γ0 = −29 km s−1. Bottom panel: ASAS-3 light curve as a function of the orbital phase (see details in section 4.3). The zero phase was calculated using the epoch Tc, when the cool component is located between the observer and the hot component.
Current usage metrics show cumulative count of Article Views (full-text article views including HTML views, PDF and ePub downloads, according to the available data) and Abstracts Views on Vision4Press platform.
Data correspond to usage on the plateform after 2015. The current usage metrics is available 48-96 hours after online publication and is updated daily on week days.
Initial download of the metrics may take a while.