Open Access
Fig. 9
Download original image
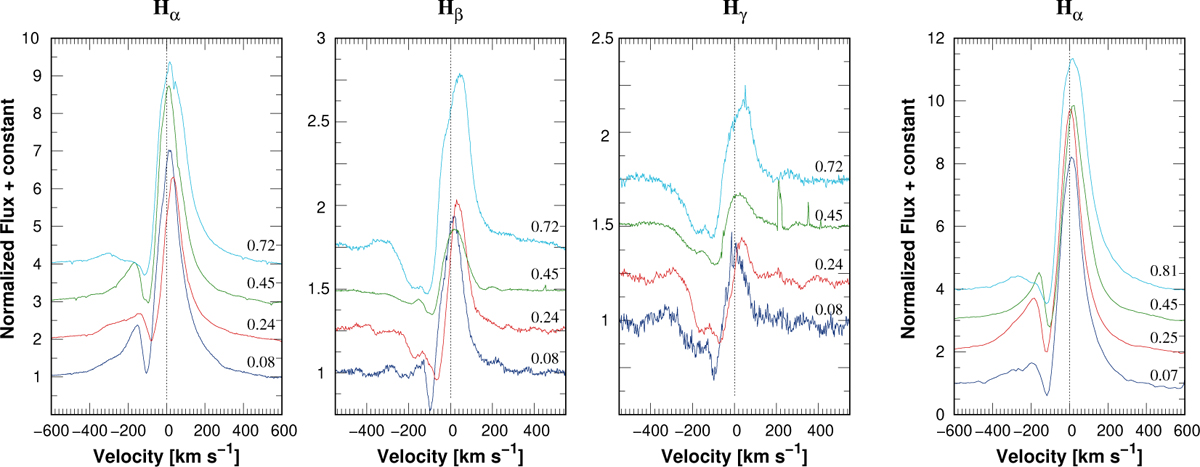
Spectra from FEROS showing changes in the Hα (first panel), Hβ (second panel), and Hγ (third panel) lines with the orbital phase. Variations of the Hα line were observed with REOSC (fourth panel). Spectra have been shifted vertically to facilitate comparison.
Current usage metrics show cumulative count of Article Views (full-text article views including HTML views, PDF and ePub downloads, according to the available data) and Abstracts Views on Vision4Press platform.
Data correspond to usage on the plateform after 2015. The current usage metrics is available 48-96 hours after online publication and is updated daily on week days.
Initial download of the metrics may take a while.