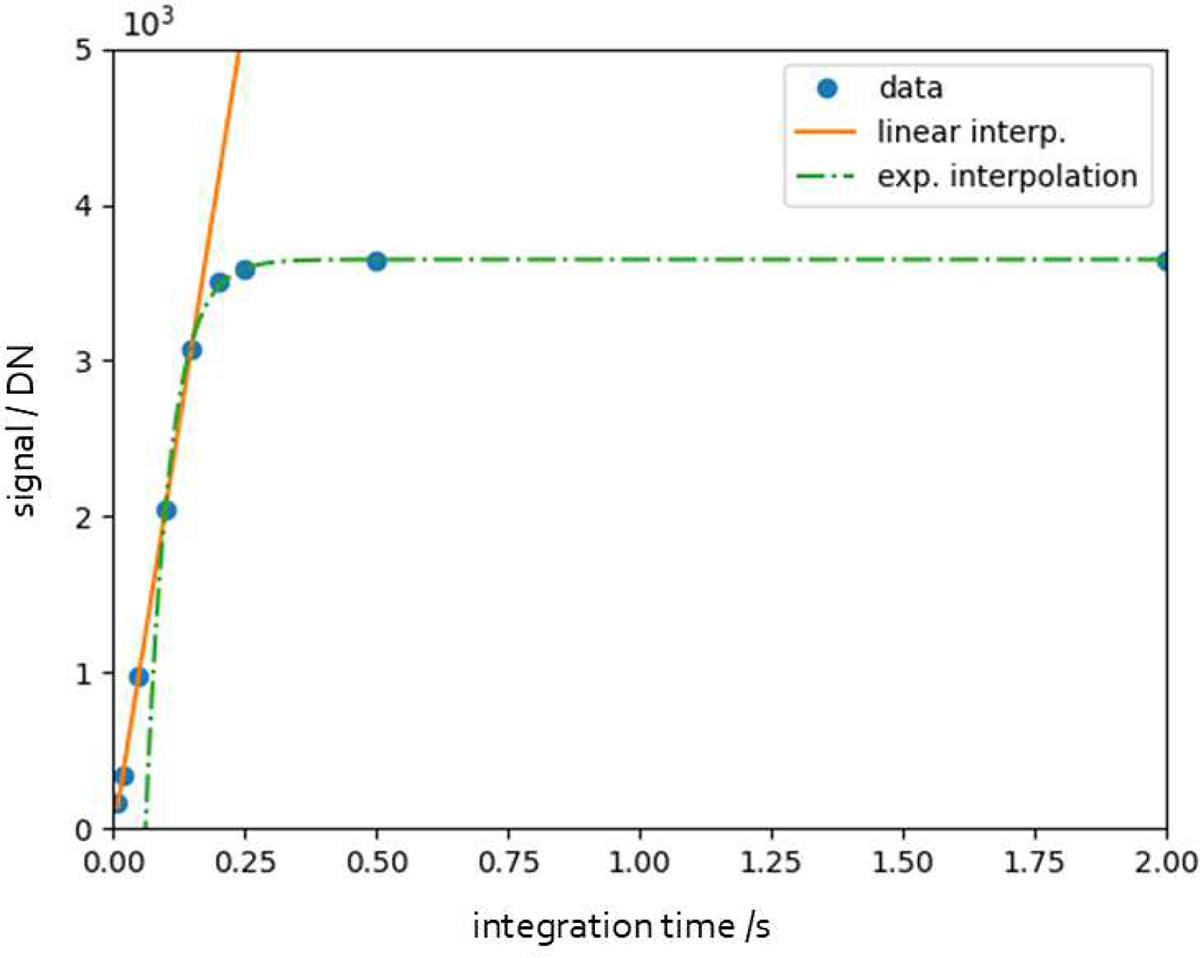
Fig. 13.
Download original image
Example of non-linearity estimation of a typical LG pixel exposed with blue 470 nm light (locally averaged using binning for statistical reasons). The LG signal is measured in DN, here shown as a function of integration time, and modelled by an exponential saturation and compared to the linear regression in the linear range of the sensor.
Current usage metrics show cumulative count of Article Views (full-text article views including HTML views, PDF and ePub downloads, according to the available data) and Abstracts Views on Vision4Press platform.
Data correspond to usage on the plateform after 2015. The current usage metrics is available 48-96 hours after online publication and is updated daily on week days.
Initial download of the metrics may take a while.