Fig. 14.
Download original image
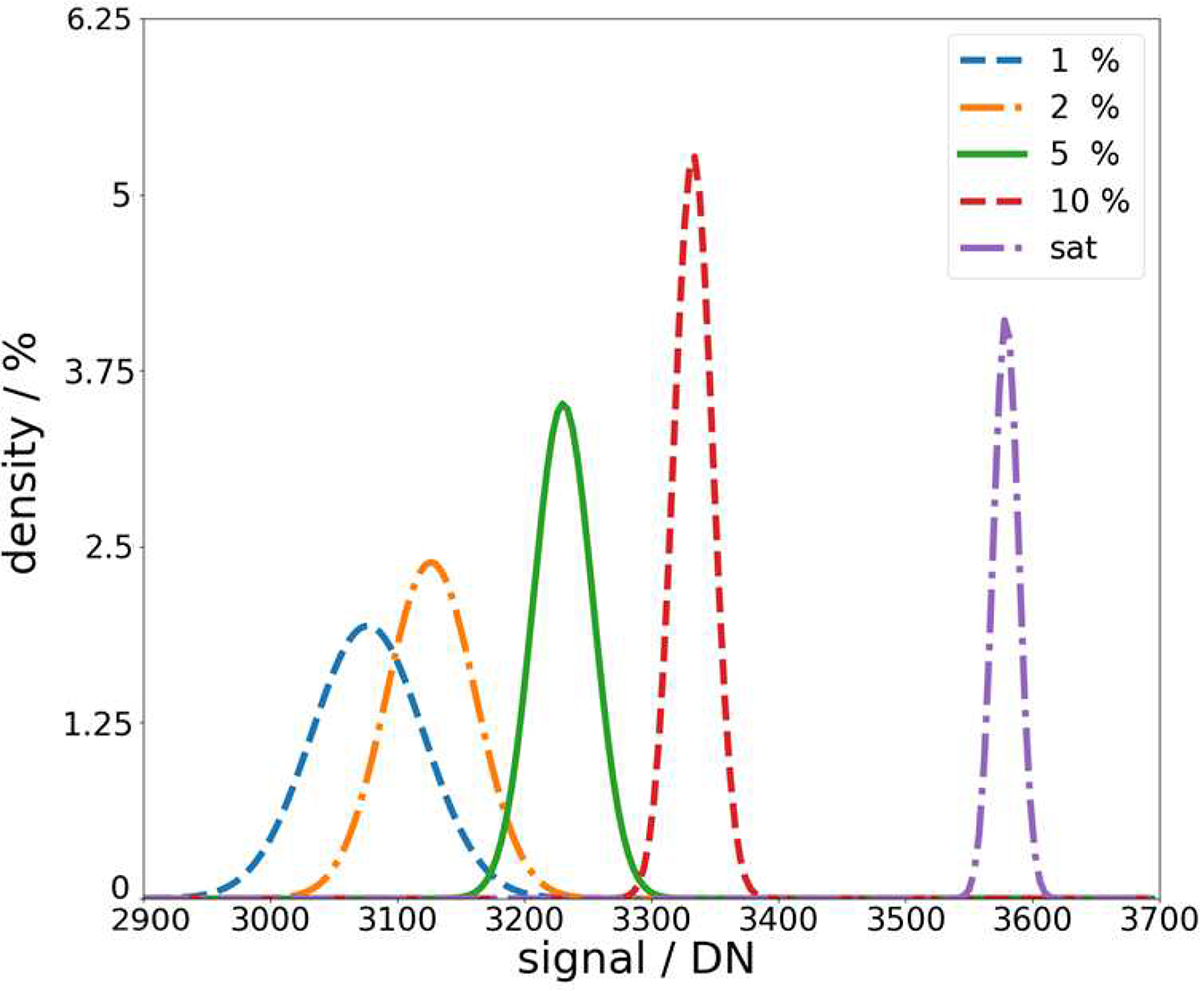
Histogram of pixels for several non-linearity levels, expressed in pixel density in percentage, and measured with on-board LED illuminated LG images. Each curve corresponds to the distribution of pixels at a given non-linearity value, close to saturation, as is indicated by the legend colour. The full well saturation is reached at around 3558 DN, which corresponds to a saturation full well capacity of 131 ke−.
Current usage metrics show cumulative count of Article Views (full-text article views including HTML views, PDF and ePub downloads, according to the available data) and Abstracts Views on Vision4Press platform.
Data correspond to usage on the plateform after 2015. The current usage metrics is available 48-96 hours after online publication and is updated daily on week days.
Initial download of the metrics may take a while.