Open Access
Fig. A.1.
Download original image
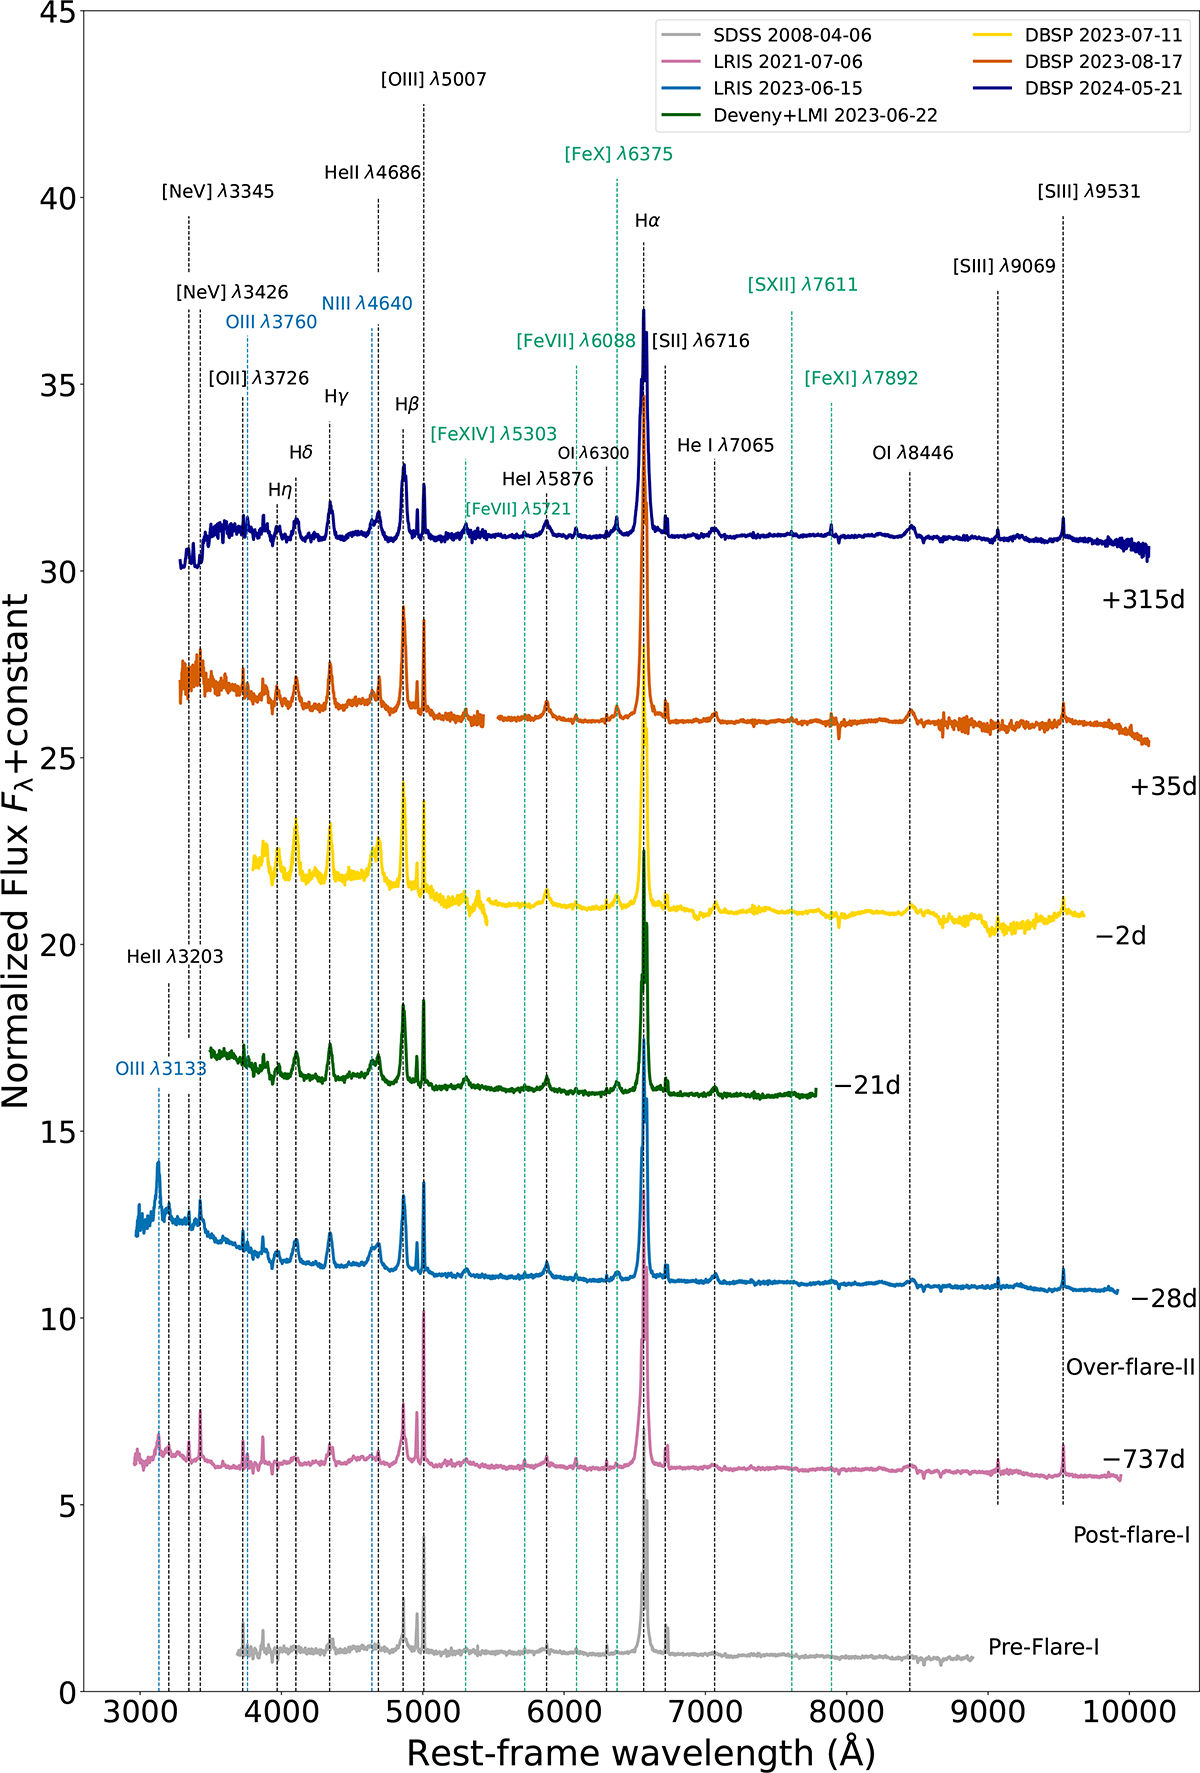
Raw optical spectra of AT2019aalc. The remarkable lines are indicated with dotted vertical lines. Days relative to the second optical peak are given to the right from each spectra. The SDSS pre-flare spectrum was observed around 11 years before the first optical flare.
Current usage metrics show cumulative count of Article Views (full-text article views including HTML views, PDF and ePub downloads, according to the available data) and Abstracts Views on Vision4Press platform.
Data correspond to usage on the plateform after 2015. The current usage metrics is available 48-96 hours after online publication and is updated daily on week days.
Initial download of the metrics may take a while.