Fig. A.3.
Download original image
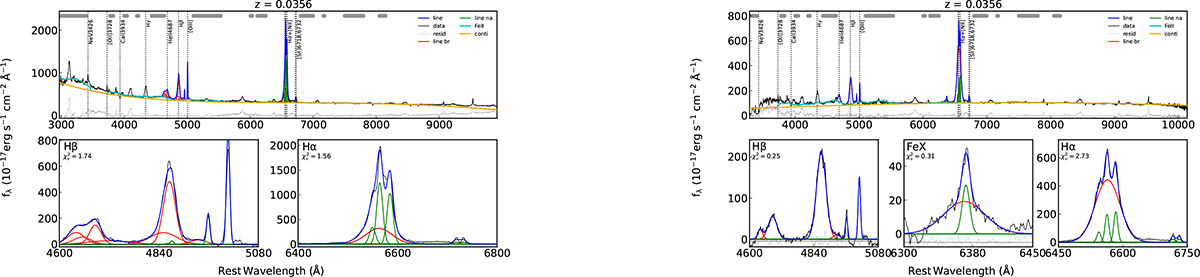
Examples of the extinction-corrected, continuum- and iron-subtracted over-flare-2 spectra fit using PYQSOFIT. The higher-resolution DBSP spectra were convolved to match with LRIS to allow comparison. The emission lines of interest were modeled with a set of broad and/or narrow Gaussian line components. Left: The LRIS spectrum taken on 2023-06-15, zooming into the Hβ and Hα regions. Right: The DBSP spectrum taken on 2024-05-21, where we also fit the [Fe X] λ6375 high-ionization coronal line as a separate component.
Current usage metrics show cumulative count of Article Views (full-text article views including HTML views, PDF and ePub downloads, according to the available data) and Abstracts Views on Vision4Press platform.
Data correspond to usage on the plateform after 2015. The current usage metrics is available 48-96 hours after online publication and is updated daily on week days.
Initial download of the metrics may take a while.