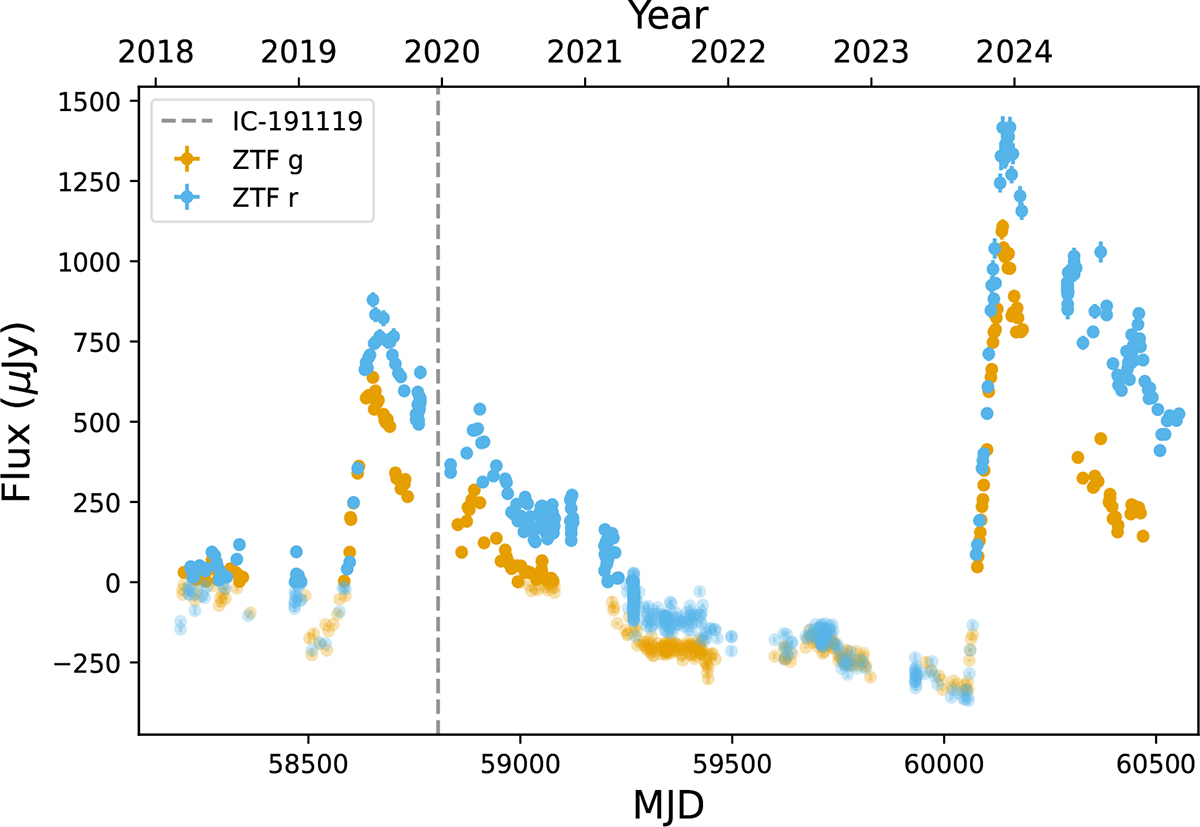
Fig. 2.
Download original image
Optical light curve of AT2019aalc derived from ZTF difference photometry. The transparent markers indicate negative flux (i.e., the flux decreased below the mean flux of the reference images). Two distinct flares can be seen. The second flare peaked 4 years after the first one. The blue vertical line indicates the arrival time of the neutrino event IC191119A associated with the transient.
Current usage metrics show cumulative count of Article Views (full-text article views including HTML views, PDF and ePub downloads, according to the available data) and Abstracts Views on Vision4Press platform.
Data correspond to usage on the plateform after 2015. The current usage metrics is available 48-96 hours after online publication and is updated daily on week days.
Initial download of the metrics may take a while.