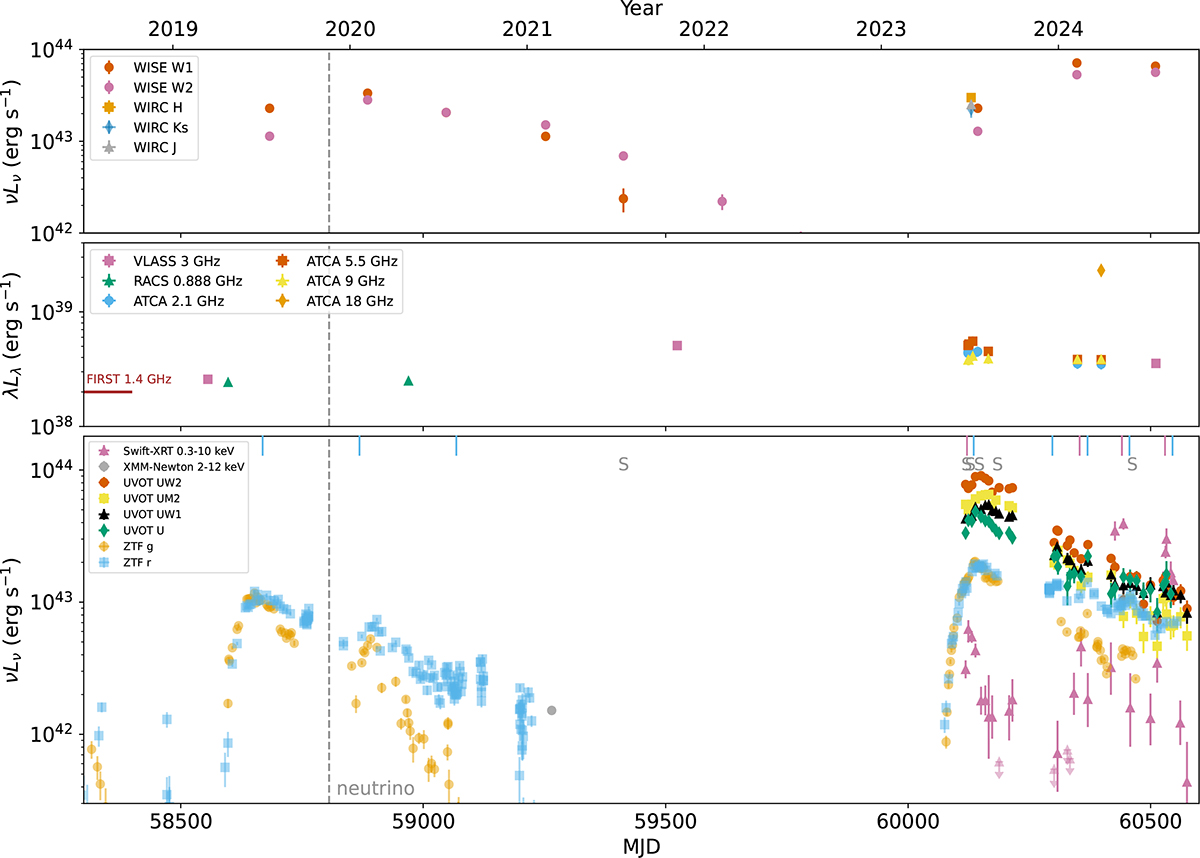
Fig. 3.
Download original image
Multiwavelength light curves of AT2019aalc. Bottom plot: X-ray and extinction-corrected and host-subtracted optical/UV. Middle plot: Multifrequency short-baseline radio. Upper plot: Extinction-corrected and host-subtracted IR. Here we show only the positive ZTF fluxes based on the forced photometry results. The dashed gray vertical line indicates the IceCube detection of the high-energy neutrino event IC191119A. The short, purple vertical lines on the top of the bottom panel indicate the peak times of the X-ray flares while the blue ones show the times the main optical r-band flare and later the bumps. The gray ‘S’ letters represent the observing times of the optical spectra.
Current usage metrics show cumulative count of Article Views (full-text article views including HTML views, PDF and ePub downloads, according to the available data) and Abstracts Views on Vision4Press platform.
Data correspond to usage on the plateform after 2015. The current usage metrics is available 48-96 hours after online publication and is updated daily on week days.
Initial download of the metrics may take a while.