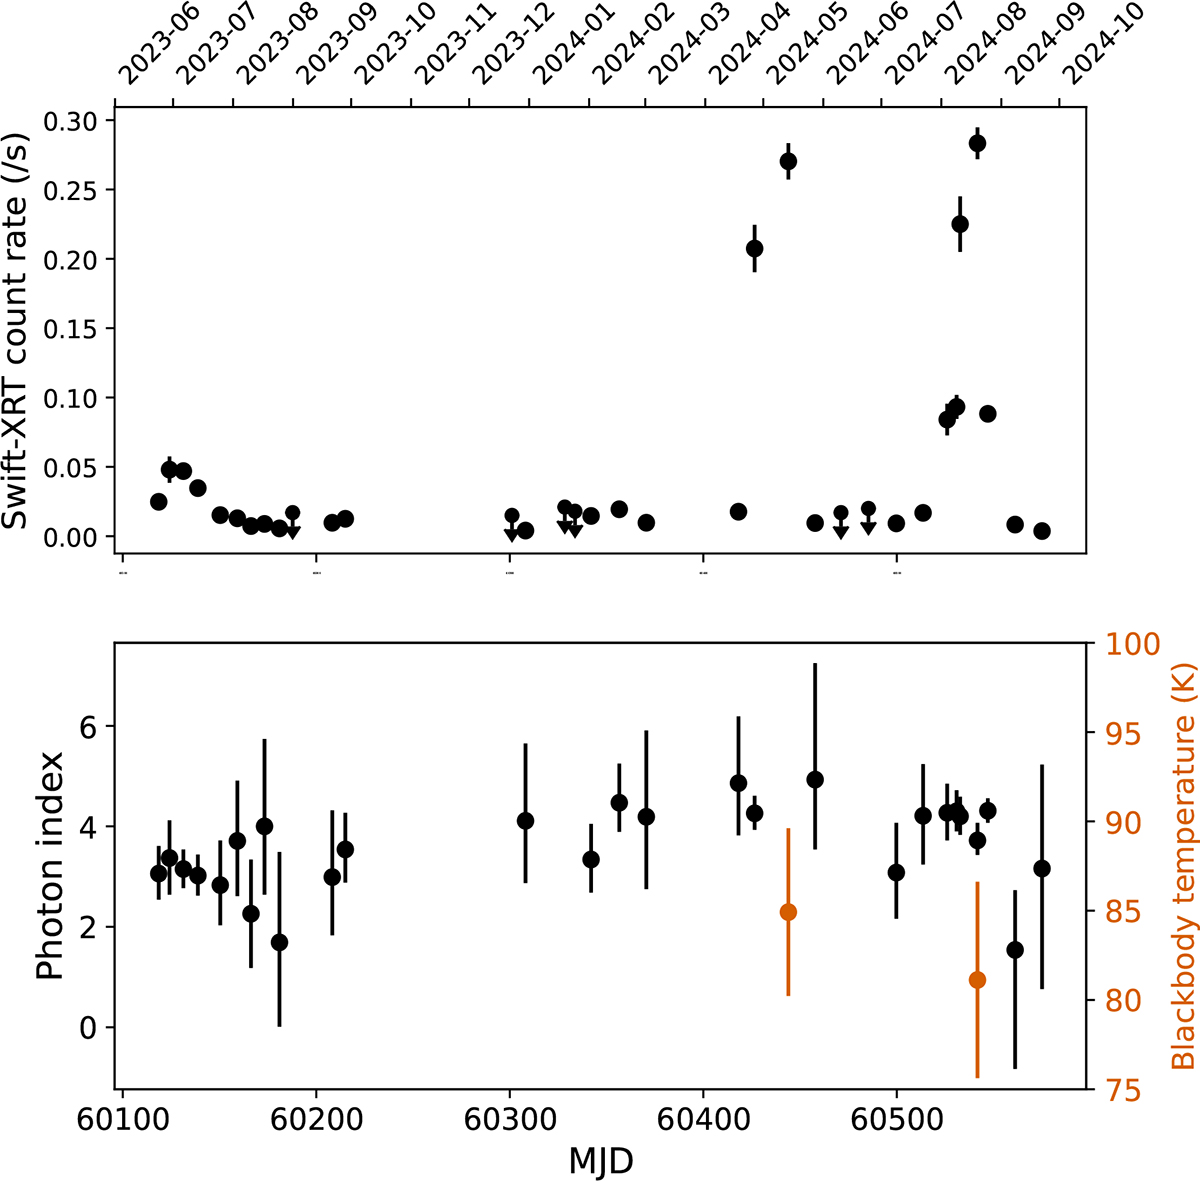
Fig. 6.
Download original image
Swift-XRT count rate and photon index variability of AT2019aalc during the observing campaign. In most cases are data is well described by a power-law spectral model (black), except during the two recent flaring episodes, where blackbody or combined models are preferred (red). The blackbody temperature is indicated on the red y-axis.
Current usage metrics show cumulative count of Article Views (full-text article views including HTML views, PDF and ePub downloads, according to the available data) and Abstracts Views on Vision4Press platform.
Data correspond to usage on the plateform after 2015. The current usage metrics is available 48-96 hours after online publication and is updated daily on week days.
Initial download of the metrics may take a while.