Fig. 10
Download original image
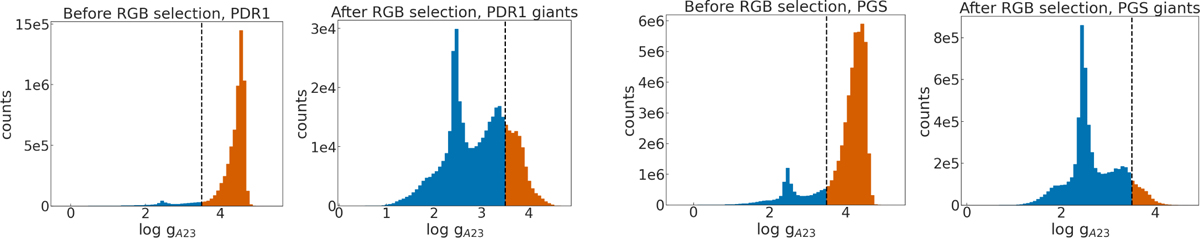
Distribution of the A23 surface gravities before and after the catalogue pipeline (described in Figure 4) is applied on the PDR1 (top) and PGS (bottom) input catalogues. The vertical line at log g=3.5 shows the separation used to validate the selected sample of giants. In all the panels, the overdensity of stars at log g~2.5 from RC stars are clearly visible.
Current usage metrics show cumulative count of Article Views (full-text article views including HTML views, PDF and ePub downloads, according to the available data) and Abstracts Views on Vision4Press platform.
Data correspond to usage on the plateform after 2015. The current usage metrics is available 48-96 hours after online publication and is updated daily on week days.
Initial download of the metrics may take a while.