Fig. 4
Download original image
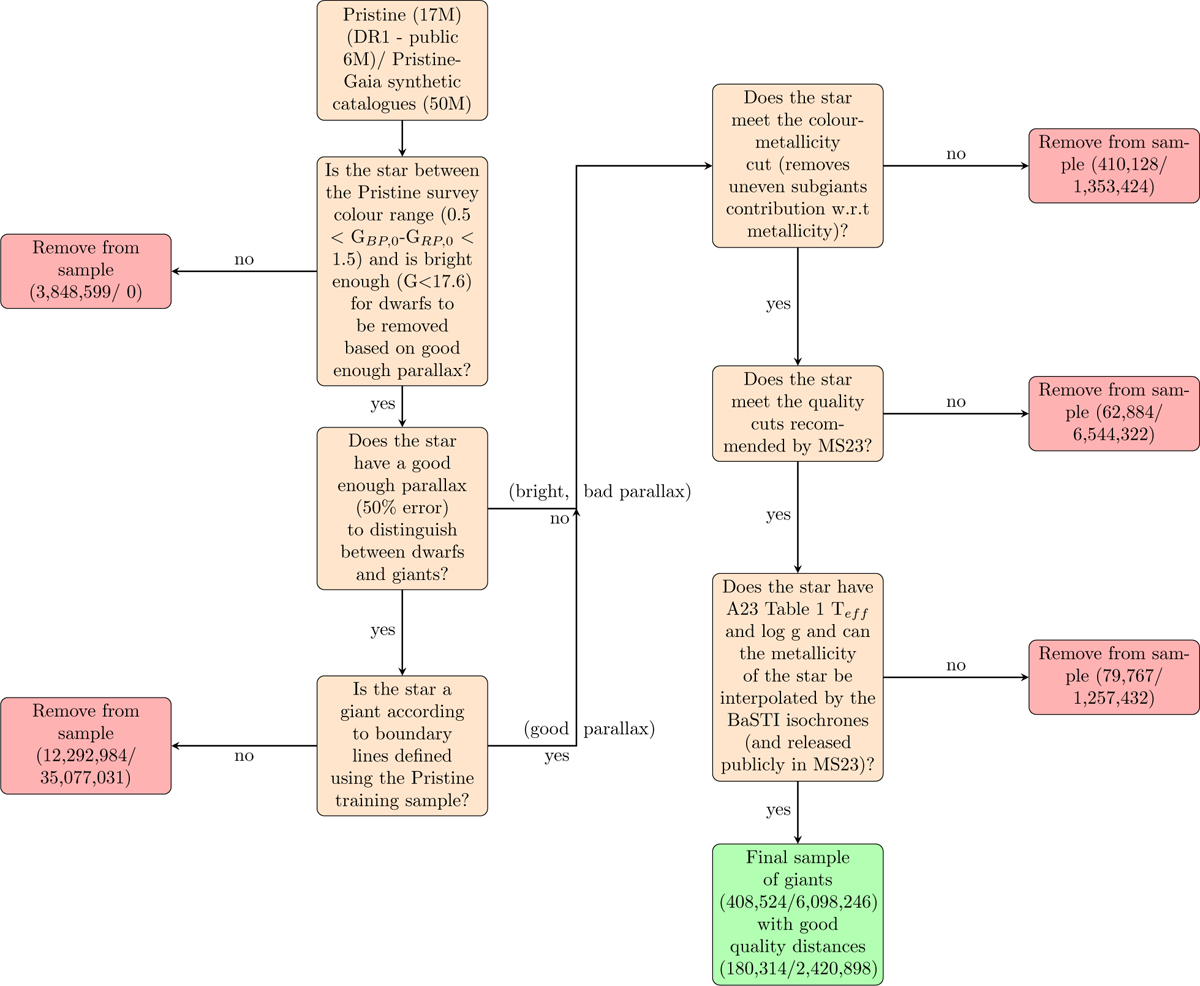
Flowchart of the steps involved in creating the two RGB star catalogues using the parent samples from PDR1 and PGS catalogues. The number of stars removed at each selection step for the two input catalogues are shown in the red boxes, the method and cuts used to select RGB stars on every step is shown in orange boxes, and the final sample with counts are shown in the green box.
Current usage metrics show cumulative count of Article Views (full-text article views including HTML views, PDF and ePub downloads, according to the available data) and Abstracts Views on Vision4Press platform.
Data correspond to usage on the plateform after 2015. The current usage metrics is available 48-96 hours after online publication and is updated daily on week days.
Initial download of the metrics may take a while.