Fig. 5
Download original image
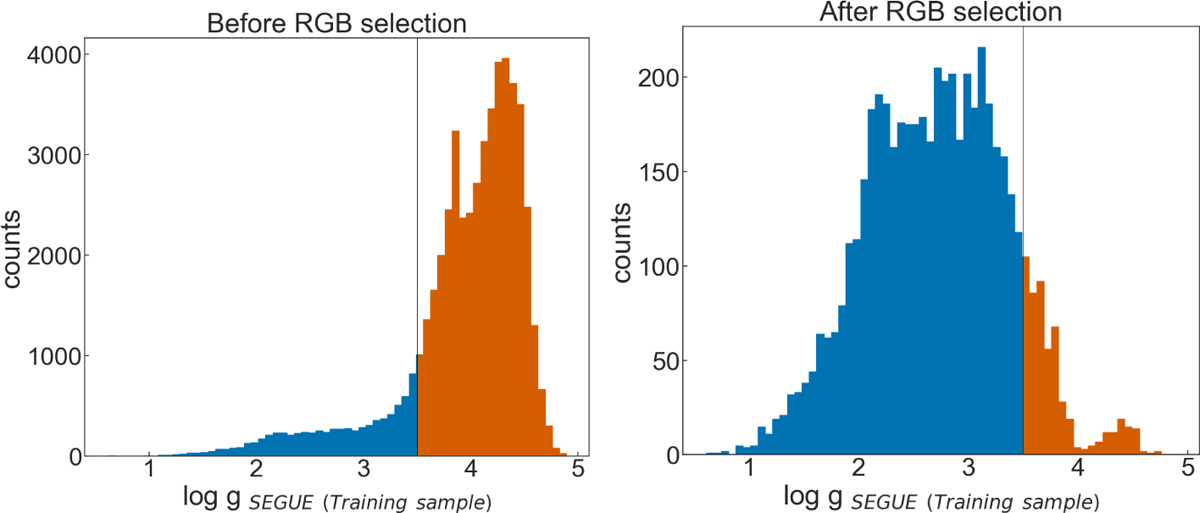
Distribution of the training sample’s surface gravities before and after the catalogue pipeline (described in Figure 4) is applied. The vertical line at log g=3.5 shows the separation used to validate the giants sample selection. The overdensity near log g~4.5 (orange region, right panel) arises from contamination by metal-rich turn-off and sub-giant stars in SEGUE, where their surface gravities overlap with the lower part of the RGB. Note that the log g<3.5 cut is an approximate validation threshold; a metallicity-dependent log g cut provides a more refined RGB selection.
Current usage metrics show cumulative count of Article Views (full-text article views including HTML views, PDF and ePub downloads, according to the available data) and Abstracts Views on Vision4Press platform.
Data correspond to usage on the plateform after 2015. The current usage metrics is available 48-96 hours after online publication and is updated daily on week days.
Initial download of the metrics may take a while.