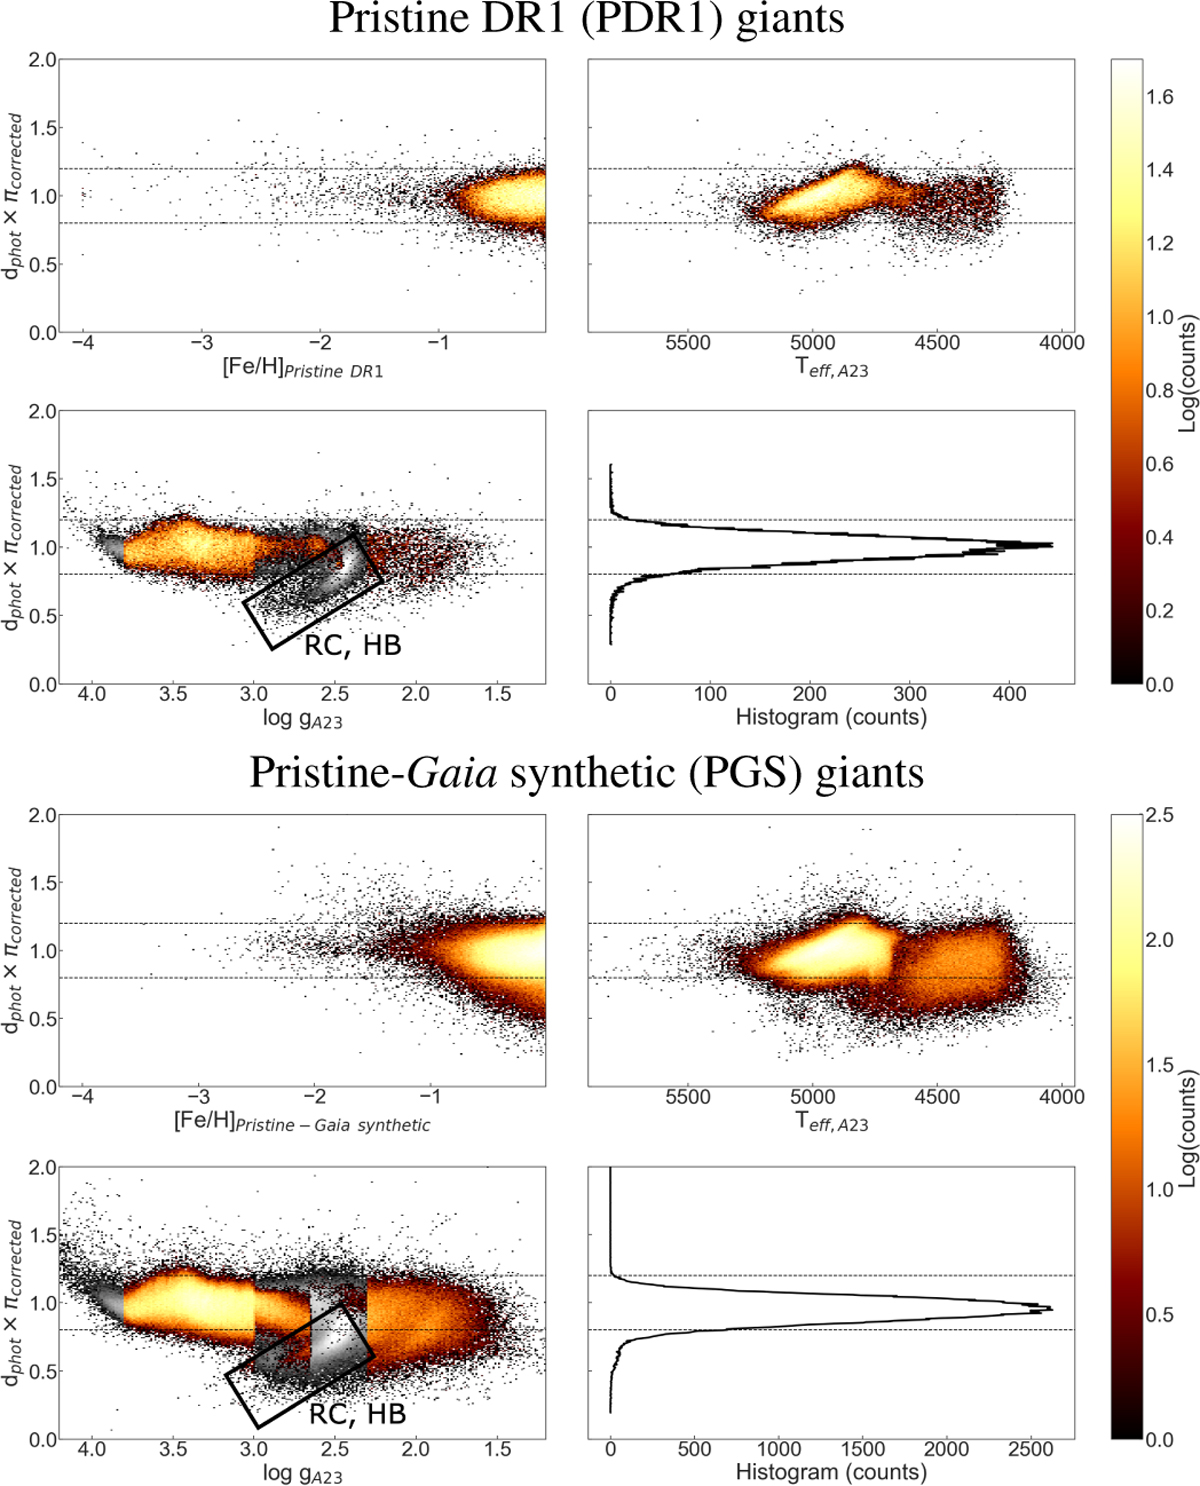
Fig. 6
Download original image
Photometric distance calculated in this work times the offset corrected parallax based on Lindegren et al. (2021) (which is supposed to be 1.0 in the ideal case) versus the input parameters to calculate these photometric distances, including photometric metallicities (top left) from PDR1 (top panels) and PGS catalogues (bottom panels), effective temperature (top right), and surface gravity (bottom left) from A23 XGBoost catalogue. The input parameters are colour-coded by the log density and horizontal histogram of distance times parallax (bottom right). Note that the density distributions are in log scale, so most of the stars are within ~10% systematic uncertainties. The grey overdensities in the surface gravity plots are bad distance mismatches caused due to red clump stars and (colder) horizontal branch stars.
Current usage metrics show cumulative count of Article Views (full-text article views including HTML views, PDF and ePub downloads, according to the available data) and Abstracts Views on Vision4Press platform.
Data correspond to usage on the plateform after 2015. The current usage metrics is available 48-96 hours after online publication and is updated daily on week days.
Initial download of the metrics may take a while.