Fig. 12
Download original image
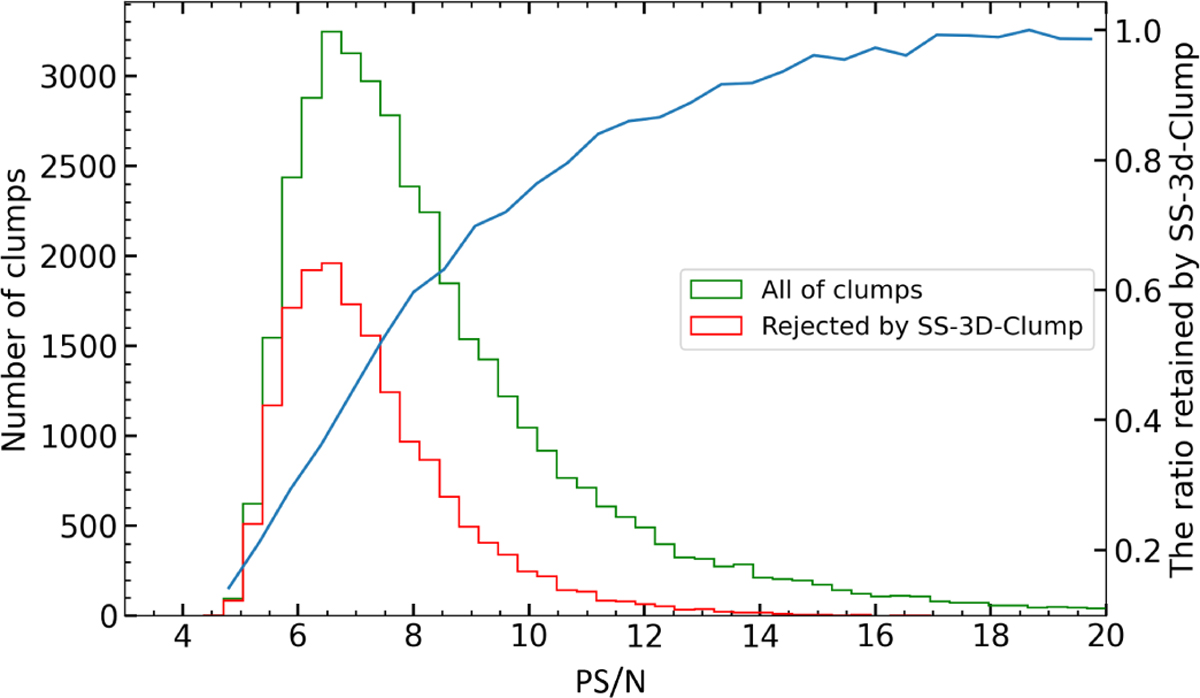
Histogram illustrating the PS/N distribution of clumps molecular clump candidates obtained by Facet-SS-3D-Clump. The green bars represent the distribution of clumps obtained by FacetClumps, while the red bars represent these rejected by SS-3D-Clump. The blue curve indicates the proportion of clumps retained by SS-3D-Clump as a function of the PS/N.
Current usage metrics show cumulative count of Article Views (full-text article views including HTML views, PDF and ePub downloads, according to the available data) and Abstracts Views on Vision4Press platform.
Data correspond to usage on the plateform after 2015. The current usage metrics is available 48-96 hours after online publication and is updated daily on week days.
Initial download of the metrics may take a while.