Fig. 14
Download original image
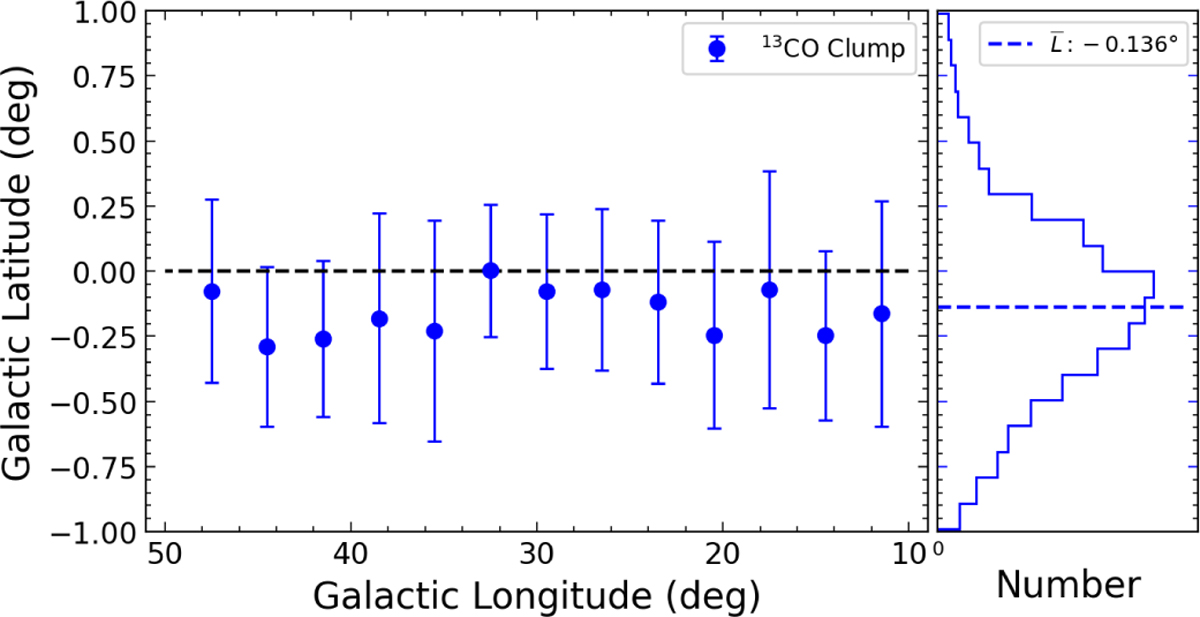
Latitude distribution of clumps in the QI. The left part illustrates the mean and standard deviation of clump distribution along latitude for various longitude intervals. Blue circular points denote the mean latitude within each interval, with error bars representing the standard deviation. The right part shows a latitude distribution of QI clumps, with the blue dashed line indicating the mean latitude.
Current usage metrics show cumulative count of Article Views (full-text article views including HTML views, PDF and ePub downloads, according to the available data) and Abstracts Views on Vision4Press platform.
Data correspond to usage on the plateform after 2015. The current usage metrics is available 48-96 hours after online publication and is updated daily on week days.
Initial download of the metrics may take a while.