Fig. 18
Download original image
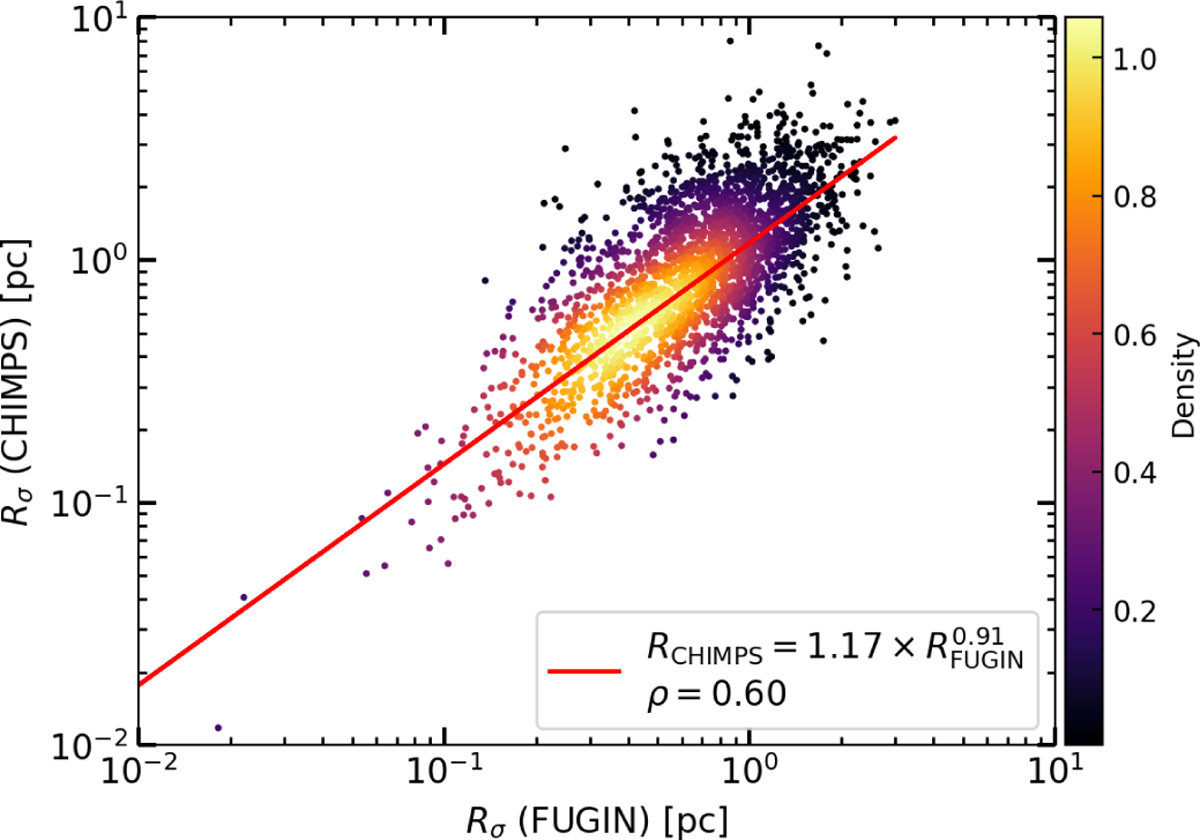
Comparison of the radii of FUGIN clumps matched to CHIMPS clumps. The distances of the FUGIN clumps are set to match these of their corresponding CHIMPS clumps. The red line represents the fitted relationship, with a correlation coefficient of 0.6. The color bar on the right indicates the local density of data points, normalized to unity, meaning that the region with the highest concentration of points has a normalized density of 1.
Current usage metrics show cumulative count of Article Views (full-text article views including HTML views, PDF and ePub downloads, according to the available data) and Abstracts Views on Vision4Press platform.
Data correspond to usage on the plateform after 2015. The current usage metrics is available 48-96 hours after online publication and is updated daily on week days.
Initial download of the metrics may take a while.