Fig. A.3
Download original image
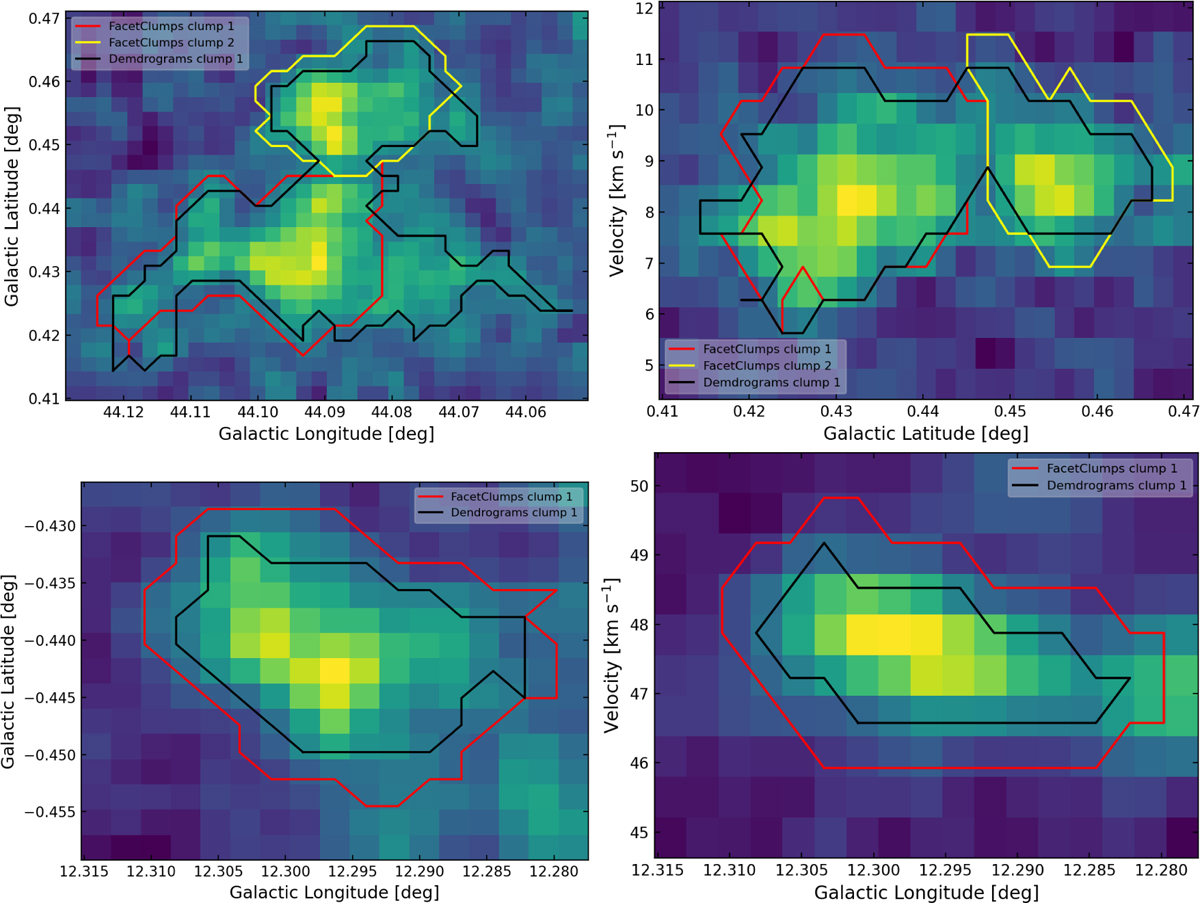
Examples of detection and matching results between FacetClumps and Dendrograms: The first row shows the matching result of two clumps detected by FacetClumps and one detected by Dendrograms. The left subplot displays the velocity-integrated map of the subregion containing the detected clumps, with the black line marking the boundary of the clump detected by Dendrograms and the red and yellow lines marking the boundaries of the two clumps detected by FacetClumps. The right subplot is similar, except the integration is along the Galactic longitude. The second row shows the matching result of one clump detected by each algorithm, with the rest of the details consistent with the first row.
Current usage metrics show cumulative count of Article Views (full-text article views including HTML views, PDF and ePub downloads, according to the available data) and Abstracts Views on Vision4Press platform.
Data correspond to usage on the plateform after 2015. The current usage metrics is available 48-96 hours after online publication and is updated daily on week days.
Initial download of the metrics may take a while.