Open Access
Fig. 3
Download original image
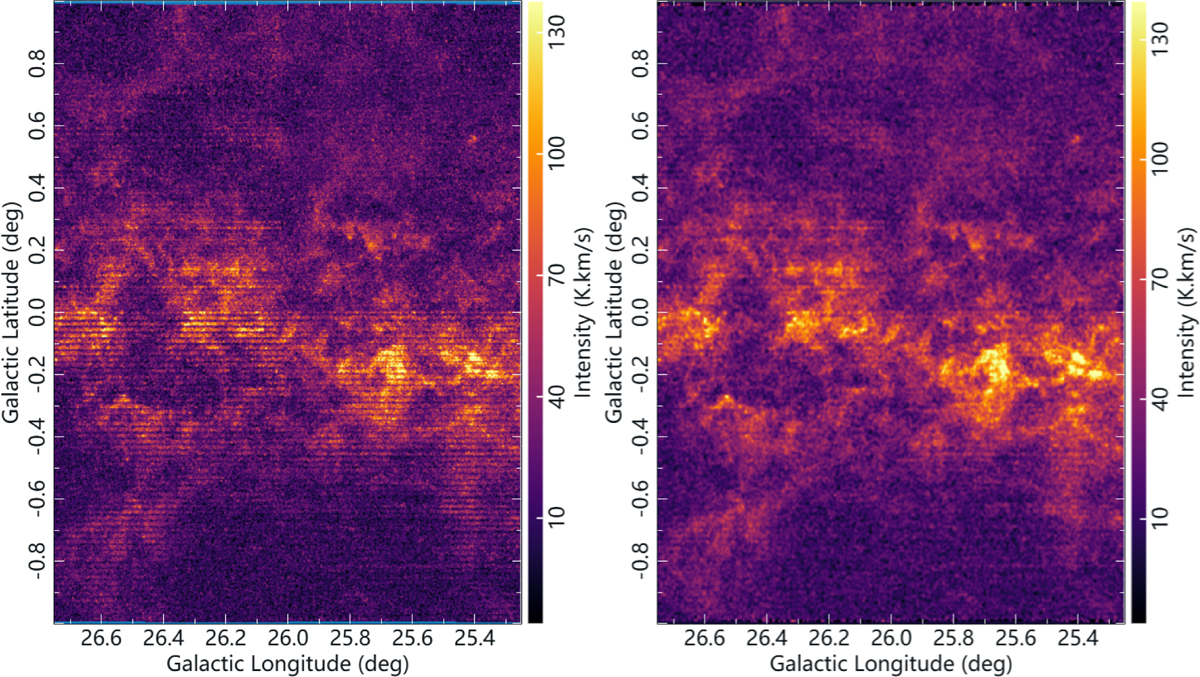
Selected region of the Milky Way (25.25° ≤ b ≤ 26.75°, −1° ≤ l ≤ 1°, and 0 ≤ v ≤ 130 km/s). Left panel displays the integrated map of the S/N data, revealing noticeable horizontal stripes. Right panel shows the result after interpolation, effectively removing the stripes.
Current usage metrics show cumulative count of Article Views (full-text article views including HTML views, PDF and ePub downloads, according to the available data) and Abstracts Views on Vision4Press platform.
Data correspond to usage on the plateform after 2015. The current usage metrics is available 48-96 hours after online publication and is updated daily on week days.
Initial download of the metrics may take a while.