Fig. 5
Download original image
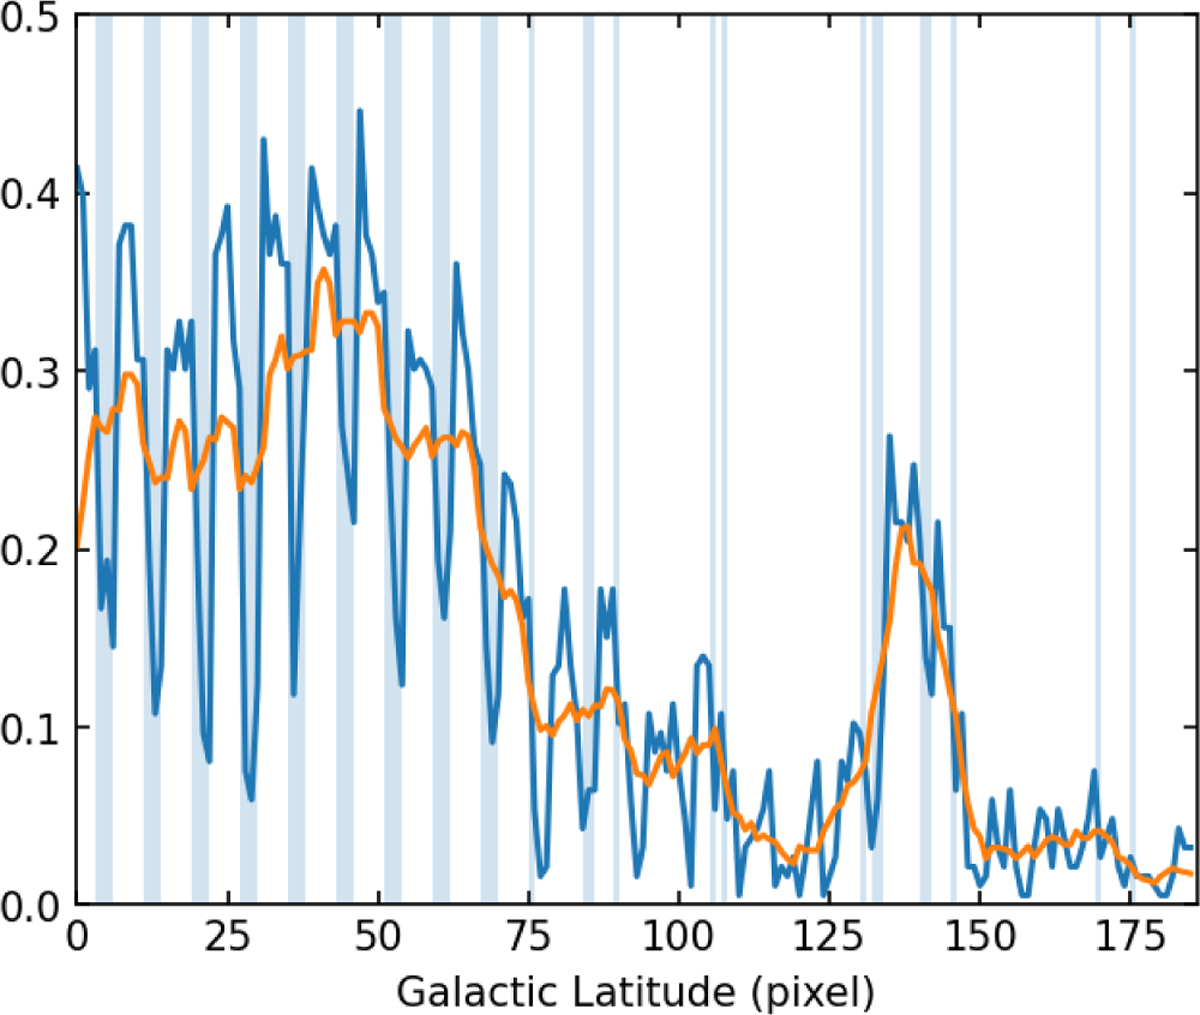
Horizontal projection curve of the original image after binarization is shown, where the blue curve represents the original projection curve, and the orange is the result of applying a moving average to the original curve. The blue shaded areas indicate the regions of stripes in the image. Note: the vertical axis in the figure has no actual physical significance; it only represents the ratio of pixels exceeding 3×rms to the total number of pixels in the horizontal direction.
Current usage metrics show cumulative count of Article Views (full-text article views including HTML views, PDF and ePub downloads, according to the available data) and Abstracts Views on Vision4Press platform.
Data correspond to usage on the plateform after 2015. The current usage metrics is available 48-96 hours after online publication and is updated daily on week days.
Initial download of the metrics may take a while.