Open Access
Fig. 9
Download original image
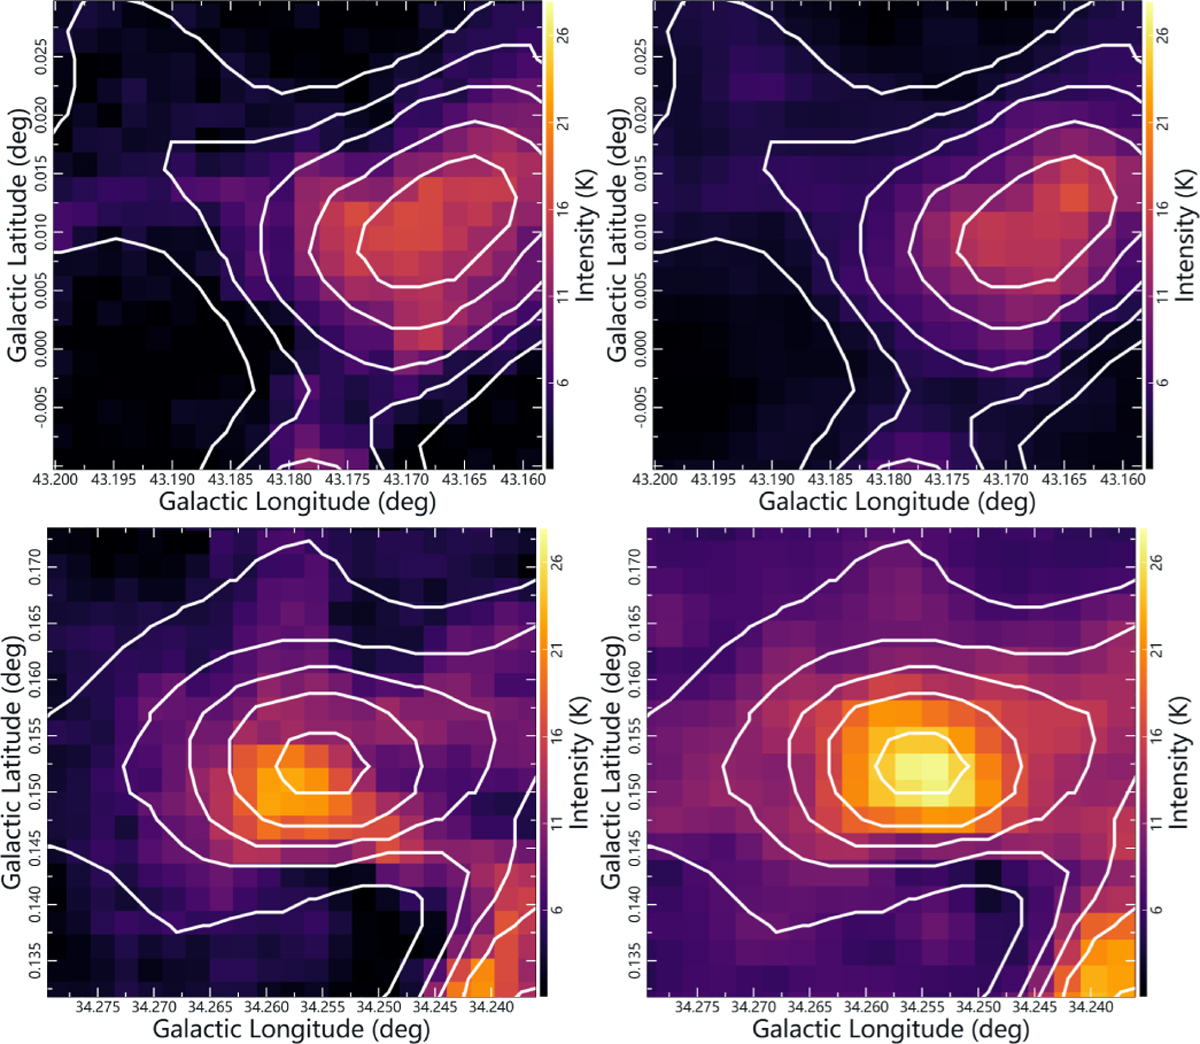
Examples of two matched clumps in CHIMPS and FUGIN are shown. The first column shows two clumps from CHIMPS, while the second column shows the corresponding matched clumps from FUGIN. The contours in the figure are drawn on the intensity map of the FUGIN clumps and overlaid onto the map of the CHIMPS clumps.
Current usage metrics show cumulative count of Article Views (full-text article views including HTML views, PDF and ePub downloads, according to the available data) and Abstracts Views on Vision4Press platform.
Data correspond to usage on the plateform after 2015. The current usage metrics is available 48-96 hours after online publication and is updated daily on week days.
Initial download of the metrics may take a while.