Open Access
Fig. 1
Download original image
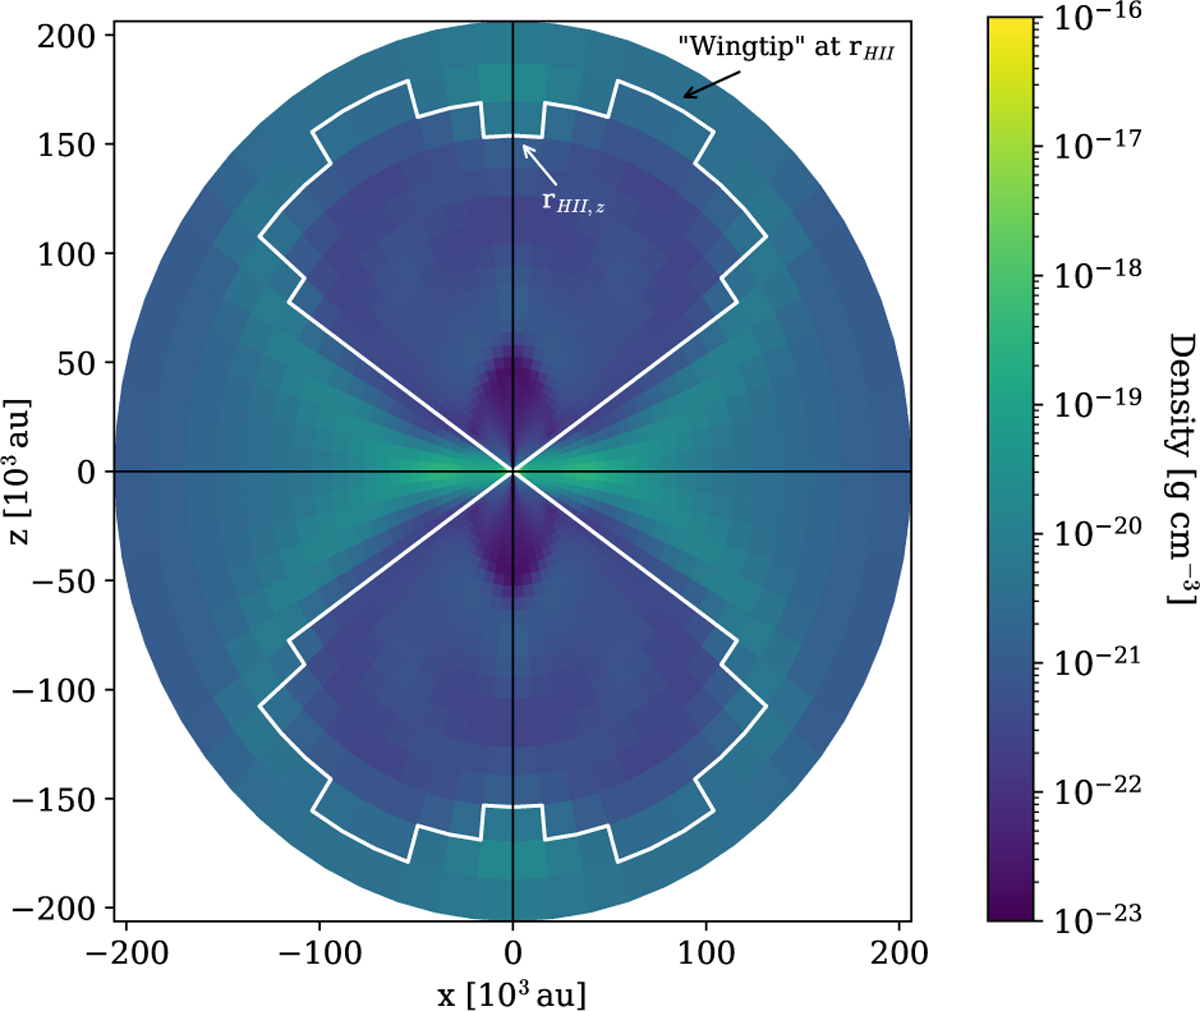
Example snapshot of typical H II region “butterfly wing” morphology, taken from run #0 in this work, as a density color map. The boundary depicted with the white outline is the region where more than 50% of the hydrogen was ionized.
Current usage metrics show cumulative count of Article Views (full-text article views including HTML views, PDF and ePub downloads, according to the available data) and Abstracts Views on Vision4Press platform.
Data correspond to usage on the plateform after 2015. The current usage metrics is available 48-96 hours after online publication and is updated daily on week days.
Initial download of the metrics may take a while.