| Issue |
A&A
Volume 706, February 2026
|
|
|---|---|---|
| Article Number | A181 | |
| Number of page(s) | 11 | |
| Section | Interstellar and circumstellar matter | |
| DOI | https://doi.org/10.1051/0004-6361/202452577 | |
| Published online | 10 February 2026 | |
Gravitational trapping and ram pressure trapping of ultracompact and hypercompact H II regions
1
Faculty of Physics, University of Duisburg-Essen,
Lotharstraße 1,
47057
Duisburg,
Germany
2
Département d’Astronomie, Université de Genève,
Chemin Pegasi 51,
1290
Versoix,
Switzerland
3
Space Research Center (CINESPA), School of Physics, University of Costa Rica,
11501
San José,
Costa Rica
4
UK Astronomy Technology Centre, Royal Observatory Edinburgh,
Blackford Hill,
Edinburgh
EH9 3HJ,
UK
★ Corresponding author: This email address is being protected from spambots. You need JavaScript enabled to view it.
Received:
11
October
2024
Accepted:
23
November
2025
Abstract
Context. Early H II regions are observationally classified by size into ultracompact and hypercompact configurations. It remains unclear whether these phases are long-lived or transient. Understanding the physical processes that stall H II region growth may help to solve the “lifetime problem”: the observation of more compact H II regions than expected from theory.
Aims. Utilizing two-dimensional, axially symmetric radiation hydrodynamic simulations of young expanding H II regions, including early star and disk formation, we seek to better understand the trapping of H II regions. Trapping forces include gravity and ram pressure, which oppose forces such as thermal pressure expansion, radiation pressure, and centrifugal force.
Methods. We used the open-source magnetohydrodynamical code Pluto, the radiation transport module Makemake, the photoionization module Sedna, and the self-gravity module Haumea. This approach resembles the setup of previous works, but without the manual injection of protostellar outflows.
Results. Without radiation pressure, the H II region remains gravitationally trapped in the ultracompact phase indefinitely. With radiation pressure, the H II region escapes gravitational trapping but experiences ram pressure trapping on larger scales. For initial mass reservoirs with a high central density, no trapping occurs, while a less steep density gradient yields clear trapped phases. Hypercompact trapped phases exhibit a “flickering” variation in H II region radius, in agreement with observations of stalling and even contraction over small timescales. With radiation pressure, low-mass or low-density reservoirs experience both gravitational and ram pressure trapping, while high-mass reservoirs undergo only the latter.
Conclusions. During the early evolution of H II regions, gravitational and ram pressure trapping may occur at different times and distances from the (proto)star, depending on environmental conditions. The mean expansion velocity is influenced by thermal pressure, gravity, centrifugal forces, and radiation pressure. For the cases studied herein, the inclusion of radiation pressure is crucial to obtaining physically meaningful results.
Key words: stars: formation / stars: massive / HII regions
© The Authors 2026
 Open Access article, published by EDP Sciences, under the terms of the Creative Commons Attribution License (https://creativecommons.org/licenses/by/4.0), which permits unrestricted use, distribution, and reproduction in any medium, provided the original work is properly cited.
This article is published in open access under the Subscribe to Open model. This email address is being protected from spambots. You need JavaScript enabled to view it. to support open access publication.
1 Introduction
During the formation of massive stars, the extreme ultraviolet (EUV) radiation of the protostar may ionize its surroundings. This ionized region is known as an HII region. The expansion of this region is a key form of stellar feedback, as H II regions make up a significant component of the interstellar medium. They offer an observational signpost for the otherwise difficult-to-observe formation of massive stars, as an H II region is the most direct evidence that a massive star has formed and has begun to ionize its environment. If an H II region is observed, there must be at least one massive star responsible for it. Though H II regions can grow to hundreds of parsecs in diameter (Oey et al. 2003), our interest lies in studying them at their smallest, during the early stages of star formation. Young H II regions fall roughly into the following categories based on radius: hypercompact for 0.0010.01 pc, ultracompact for 0.01-0.1 pc, and compact for 0.1 to 0.5 pc. These are the ranges used in works such as Gaume et al. (1995), but we note that other works may choose to associate different radius ranges with the same terms (see, e.g., Kurtz 2005). These size categories are primarily observational, based on the resolved angular size of the regions (Gaume et al. 1995), rather than tied to distinct physical transitions.
The first survey of ultracompact H II (UCH II) regions was presented in Wood & Churchwell (1989), in which 75 sources were identified. Prior to 1989, only a handful of UCH II regions had been described. Gaume et al. (1995) presented the first hypercompact H II (HCH II) region, prompting further surveys for H II regions in this size range in the following decades.
By the mid-2000s, eight major surveys of UCH II regions had been performed, resulting in hundreds of identifications, while a handful of HCH II regions had been found (see Kurtz (2005) for a summary of these surveys). In the 2010s and beyond, UCH II and HCH II surveys included Urquhart et al. (2013) based on the ATLASGAL survey; Cesaroni et al. (2015) based on the Herschel/Hi-GAL survey; Kalcheva et al. (2018) based on the CORNISH survey; Klaassen et al. (2018), which presented ALMA observations of nine young H II regions; and Yang et al. (2021), which identified 16 HCH II candidates from VLA observations. Observations of individual UCH II and HCH II regions include Beuther et al. (2022), Cesaroni et al. (2019), Maud et al. (2018), Moscadelli et al. (2018), Beltrán et al. (2018), Klaassen et al. (2009), Sollins et al. (2005), Keto (2002), Ball et al. (1996), and Guzman et al. (2014), among many others.
The H II region expansion has two phases, each driven by a different physical process: R-type (short for “rarefied”) and D-type (short for “dense”). The initial supersonic R-type expansion phase is photoionization driven and very short lived. During this phase, an ionization front, the boundary between the ionized and neutral hydrogen gas, forms and moves outward from the protostar. This phase ends once the ionization front reaches the Strömgren radius, at which there is equilibrium between ionization and recombination. Subsequently, the high thermal pressure of the hot (~104 K) ionized gas drives slower subsonic D-type expansion into the surrounding cold neutral medium (Kahn 1954; Draine 2011).
Once an H II region begins pressure-driven D-type expansion, its theoretical expansion velocity is on the order of the sound speed of the ionized gas (~10 km/s). At this speed, an H II region would expand beyond the ultracompact phase in only ~104 years (Comeron & Torra 1996). This short theoretical lifetime conflicts with the large observed number of compact H II regions, suggesting that one or more mechanisms must be acting to restrict or stall their expansion (Kurtz 2000).
One possibility is that the ionized gas is initially prevented from beginning R-type expansion because it is gravitationally bound to the protostar. This mechanism is referred to as gravitational trapping. Gravitational collapse also leads to an inward flow of gas toward the protostar, which impacts the H II region at larger radii later on. At these later stages during slower D-type expansion, the infalling gas slows H II region expansion via ram pressure applied directly against the expanding ionized gas (Walmsley 1995). We refer to this mechanism as ram pressure trapping.
During both early and late expansion phases, continuum radiation pressure from the forming star contributes to pushing the (dusty) ionized gas outward. Furthermore, line-driven stellar winds contribute to disk ablation and ending the accretion phase (Kee & Kuiper 2019).
Additionally, the rotation of the gas applies a centrifugal force cylindrically outward. This may guide the H II region into a characteristic “butterfly” morphology, with top and bottom lobes around the central axis shaped on the midplane by an accretion disk. (See Fig. 1 for a simulation snapshot with an H II region demonstrating the classic “butterfly” morphology and Fig. A.1 for the development of this morphology over time.) Given that the centrifugal force is directed outward, it may also contribute toward expansion.
The proper motion of the star itself through its surroundings can also change the morphology and expansion rate of the H II region. If the ionizing star moves to the edge of a cloud, this can also result in “champagne flows” (Tenorio-Tagle 1979) and “blister-type” (cometary) shapes (Israel 1978). (Proper motion is not addressed further in this work, but see Arthur & Hoare (2006) for more information.)
The “lifetime problem" refers to the aforementioned discrepancy between the theoretically predicted lifetime of H II region compact phases and the observed ratio of compact HII regions to noncompact. Assuming expansion occurs at sound speed and is unhindered by feedback, we expect to observe far fewer HCH II, UCH II, and compact H II regions than are actually observed (Kurtz 2000). As far back as the groundbreaking survey in Wood & Churchwell (1989), UCH II region lifetimes were determined to last even into the main sequence phase of stellar evolution (105−106 years) based on the number of H II regions observed in each phase. Later, Comeron & Torra (1996) predicted lifetimes of 104 years with statistical analysis of UCH II observations, but such lifetimes still require a mechanism to slow expansion. Mottram et al. (2011) estimated lifetimes closer to those in Wood & Churchwell (1989).
The lifetime problem may be resolved if the expansion of compact H II regions is not always monotonic. Both simulations and observations suggest that these regions can stall or even contract over years to decades. This “flickering” phenomenon is supported by multi-epoch observational studies that have reported significant variability in compact H II region emissions. For example, Franco-Hernández & Rodríguez (2004) reported a 20-30% decrease in radio continuum flux density from the UCH II region NGC 7538 IRS 1 over 11 years, while De Pree et al. (2014) and De Pree et al. (2018) observed similar decreases in sources within the massive star-forming regions Sgr B2 and W49A, respectively.
A theoretical basis for this flickering is provided by threedimensional simulations from Peters et al. (2010), which suggest that accretion flows onto massive stars are gravitationally unstable, creating dense clumps and filaments that cause the H II region to rapidly fluctuate in size. Notably, these influential simulations did not include radiation pressure. While accretion-driven flickering provides a compelling solution to the lifetime problem, the role of radiation pressure in this process remains unclear. In this work, we use numerical simulations to investigate the effect of radiation pressure on the trapping and expansion and thus on the lifetimes of compact H II regions.
The basic aim of this numerical experiment is to check if the expansion of the H II region during its D-type evolutionary phase can be halted for some time due to the gravity of the hot host star and/or by the ram pressure from the infalling gas from larger spatial scales. In the cases in which the H II region is trapped, we measured the lifetime of these trapped phases and checked for the corresponding sizes of the H II region in comparison to the commonly used categories of “hypercompact” (≤0.01 pc ~ 2000 au) and “ultracompact” (≤0.1 pc ~ 20 000 au) H II regions. Furthermore, to check the impact of radiation forces and whether the trapping, the sizes, and/or the timescales depend on the mass distribution of the initial cloud reservoir, we performed simulations for different core masses and different density slopes, and we ran all of these setups once with and without radiation forces included.
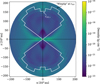 |
Fig. 1 Example snapshot of typical H II region “butterfly wing” morphology, taken from run #0 in this work, as a density color map. The boundary depicted with the white outline is the region where more than 50% of the hydrogen was ionized. |
2 Methods
2.1 Physics
This work describes two-dimensional axially and midplane symmetric simulations. This configuration enables the modeling of circumstellar disk formation and evolution simultaneously with the earliest expansion of H II regions (Kuiper & Hosokawa 2018).
To study the viability and strength of the proposed trapping processes, we ran direct numerical simulations that included all relevant physical processes. We outline the physical processes included and their significance in our approach below:
Photoionization feedback from stellar irradiation allowed us to model the R-type expansion phase of early H II regions.
The hydrodynamics evolution of the system allowed us to study the subsequent D-type expansion phase.
The gravity of the star and self-gravity of the surrounding gas were included to check for the viability of gravitational trapping.
By following the evolution of the system from the large-scale collapse of a massive reservoir of gas and dust down to the formation of the EUV-emitting star, the models self-consistently include the effects of large-scale infall and ram pressure during the D-type expansion phase of the H II region.
The radiation transport modules of continuum radiation and photoionization both include the impact on the hydrodynamic evolution of the surrounding gas and dust via radiation forces due to absorbed momentum (Kuiper et al. 2020).
We also studied the effect of different environments on these physical processes by varying the total mass of the initial reservoir as well as its initial density distribution.
We started with a spherical core of gas and dust that collapses under its own self-gravity representing, for instance, a high-density region within a giant molecular cloud. Fig. 2 provides a visualization of the initial state of the mass reservoir. During the course of the simulation, a protostar with an accretion disk forms from the collapsing gas and then begins emitting both from its interior and from the accretion shock front. The EUV component of these emissions ionizes hydrogen around the star, creating an H II region.
For the hydrodynamics of the gas and dust, we used the opensource grid-based code Pluto (Mignone et al. 2007, 2012). We included an α-shear viscosity prescription to model the angular momentum transport in the accretion disk due to gravitational torques. The system is modeled as a calorically perfect gas, with additional acceleration source terms for self-gravity, the gravity of the forming massive star, radiation transport, and photoionization.
The self-gravity solver Haumea is described in more detail in Kuiper et al. (2010). We also reference the gravitational binding radius given by (Keto 2003):

where cs,ion is the isothermal sound speed of the ionized gas. This is the theoretical radius at which the thermal pressure expansion of the hot H II region is balanced by the gravitational pull of the central stellar mass, M*.
The radiation pressure is derived from the radiation field, which we calculated with the module Makemake (Kuiper et al. 2020) using the two-temperature approach. In short, this module divides the total radiation flux into two components: frequencydependent stellar irradiation and diffusive thermal (re-)emission by dust and gas. The irradiation flux is computed via ray tracing, for which we used the dust opacities from Laor & Draine (1993). More specifically, the spectrum of the forming massive star is divided into 56 frequency bins. The non-ionizing part of the spectrum is resolved by 54 of these bins, which are used to accurately determine the dust heating and the radiation force via direct stellar irradiation. The far-ultraviolet regime (6 eV ≤ hν ≤ 13.6 eV) and the EUV regime (hν ≥ 13.6 eV) are each treated as a single bin for the purpose of transport. While using a single bin for the EUV radiation is an approximation, the total energy in this bin is calculated by first filtering the stellar spectrum with a realistic stellar atmosphere model to ensure an accurate ionizing flux (Kuiper et al. 2020).
The effective absorption cross section for the single EUV bin is not constant but calculated as a function of the stellar temperature (Tstar) using the analytical fit:

(See Kuiper et al. (2020) for further details.) For a typical stellar temperature of 40000 K, this results in a cross section of approximately 3.2 × 10 18 cm2.
The dust opacities for the far-ultraviolet and EUV bins are κdust = 4 × 104cm2g−1 and 2 × 104cm2g−1, respectively. The gas has a constant opacity of 0.01 cm2 g−1.
The thermal (re-)emission flux is treated as frequencyindependent and computed with the flux-limited diffusion approximation. For protostellar evolution, we used the evolutionary tracks by Hosokawa & Omukai (2009).
The hydrogen photoionization is handled by the module Sedna (Kuiper et al. 2020), which we summarize as follows. The part of the spectrum of the proto(star) with photons capable of ionizing hydrogen is first filtered while also taking into account the effect of a Kurucz-like stellar atmosphere instead of a simple blackbody spectrum, and ray tracing is performed in order to compute the radiative EUV flux:

Here, rmin corresponds to the radius of the central sink cell (3 au), and the initial flux, FEUV(rmin), is determined from the stellar evolution module based on the star’s current mass and radius. The factor exp(-τtot) denotes the total extinction of the radiative flux along the path, and the optical depth, τtot, has contributions from the ionization of hydrogen and the continuum extinction by dust grains and gas. The contribution to the optical depth due to ionization depends on the ionization fraction x, which is computed simultaneously via rate equations, which express how x changes in a given region due to radiative ionization, collisional excitation, and recombination. To handle the net effect of recombination, we used the on-the-spot approximation, which assumes that all diffuse Lyman continuum photons produced by direct recombinations to the ground state are immediately reabsorbed locally.
The gas temperature is set by a physical prescription based on the local ionization fraction, which is a valid approach for photoionized regions where the temperature is set by ionization and recombination equilibrium rather than hydrodynamic heating or cooling. The gas temperature of a fully ionized region is set to 8000 K, while the temperature of a fully neutral medium is assumed to match that of the dust. The temperature of a partially ionized medium is computed as a linear interpolation between these states. This temperature is then used to calculate the gas pressure, which provides the back-reaction on the hydrodynamic momentum and continuity equations.
To quantify the radiative feedback from the central star, we calculated the ionizing photon rate (S*) at each timestep. This rate is derived from the ionization-irradiation temperature (Tion) and radius (rion) provided by the stellar evolution module. The photon rate is determined by calculating the total ionizing luminosity (Lion) and dividing by the average energy per ionizing photon. Given an average photon energy equal to the ionization potential of hydrogen (13.6 eV), the rate is given by

We generally followed the setup described in Kuiper & Hosokawa (2018) but disabled the manual injection of early protostellar outflows. In that work, injected protostellar outflows created large low-density bipolar cavities that allow the H II region to expand freely without trapping. This outflow-driven simulation scenario in Kuiper & Hosokawa (2018) provides a model for observational counterparts such as S106 (Bally et al. 1983). In this study, we investigate the opposite limit by disabling the manual injection of outflows to determine if trapping is a natural occurrence in their absence. Another possible scenario to apply would be cases where the occurrence of protostellar outflows and the expansion of H II regions are separated in time.
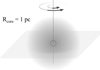 |
Fig. 2 Cloud at the start of the simulation before collapse, displayed in 3D. The rotation and the midplane are indicated. |
2.2 Geometry and boundary conditions
The mass reservoir has a spherical shape and a size of 1 pc. We used an axisymmetric, two-dimensional grid in spherical coordinates that also assumes midplane symmetry. There is a sink cell at the center of the mass reservoir of 3 au in radius; we refer to Kuiper & Hosokawa (2018) for a convergence study on the size of the sink cell. The massive (proto)star is formed inside the sink cell during the simulation. Matter is allowed to flow into the sink cell, but not to leave it. There are 114 cells in the radial direction scaling logarithmically with distance to the sink cell. Matter may exit at the outer boundary but not reenter. The polar angle uses 16 cells and extends uniformly from θ = 0 to θ = π/2. The size of the mass reservoir (1 pc) is large enough so that its free-fall time is much longer than the accretion time of the forming star so that it can be thought of as virtually infinite.
Simulation parameters.
2.3 Initial conditions
The initial rotation is given by an angular velocity profile inversely proportional to the distance, R, from the rotation axis: Ω ∝ R−1. The proportionality constant is fixed by the initial rotation to the gravitational energy ratio, which we set to 2%. The gas temperature is initially uniform and set to 10 K. The initial density profile is spherically symmetric with the following dependence on distance, r, from the origin:

where Rcore is the radius of the cloud.
Two initial density profiles were used: one with βρ = −1.5 and one where βρ = −2.0. In the latter case, the cloud mass is more concentrated closer to the star. A setup with βρ = −2.0 yields a higher accretion rate, faster initial growth of the star, and a higher accretion luminosity feedback, while a setup with βρ = −1.5 yields stronger ram pressure from the infall of the gas from large scales. The exact impact of the different reservoir masses and density profiles is further complicated by the fact that the accretion histories lead to different durations of the bloating phase of the protostar, which delays the onset of photoionization feedback (Kuiper & Hosokawa 2018). The two values of the density profiles used mark the most extreme cases of observed density profiles in high-mass star-forming regions on scales up to approximately 0.1 pc to 1 pc (Gieser et al. 2022; Beuther et al. 2024). Table 1 presents all combinations of Mcore and βρ that we used.
3 Results and discussion
We performed eight simulations in two sets. The first five simulations (runs #0-4) included radiation pressure, while the latter three simulations (runs #5-7) had radiation pressure switched off. For now, we consider the simulations with the initial density profile βρ = −1.5. Table 1 contains all parameter combinations used. Figure 5 displays the growth of the H II region radius (rHII) as the (proto)star increases in mass for each of the initial reservoir mass conditions and with radiation pressure switched on and off.
3.1 Gravitational trapping and radiation pressure
The first barrier the H II region must overcome in order to expand the gravity of the (proto)star. Figure 5 includes a representation of this barrier in the critical radius, rbinding. In the absence of radiation pressure, the gravitational pull of the (proto)star was sufficient to keep the H II region trapped for the duration of the simulation in all mass cases.
Case 250-1.5-NORAD provides a clear example of gravitational trapping in the absence of radiation pressure, as the H II region boundary rHII, z on the central axis cleanly and continually followed the gravitational binding radius. This coupling indicates gravitational trapping. The binding radius represents the equilibrium point where the outward thermal pressure of the ionized gas is balanced by the inward gravitational pull of the (proto)star. In the absence of other strong outward forces such as radiation pressure, the H II region’s D-type expansion halts at this boundary. The agreement between simulated H II region extent and rbinding thus provides direct evidence for the gravitational trapping mechanism.
Away from the central axis, centrifugal force extended the boundary rHII further out. Figure 6 shows the difference between the boundary extent on the z-axis, rHII,z, and the maximum extent away from the z-axis, rHII. In Fig. 1, rHII corresponds to the tips of the “wings” as depicted in 2D. However, even this maximum boundary remained within the hypercompact phase for the entire simulation time. Similarly, in cases 500-1.5-NORAD and 1000-1.5-NORAD, the H II region was unable to escape the gravity of the (proto)star and its surroundings. The H II region in 500-1.5-NORAD failed to escape the hypercompact phase, and the maximum boundary radius away from the axis tracked rbinding closely. In 1000-1.5-NORAD, the boundary at the axis followed rbinding, while away from the axis, the boundary very gradually diverged from rbinding until just barely escaping into the ultracompact phase when the star was already over 200 M⊙. In all cases without radiation pressure, the expansion of the H II region was visibly gravitationally constrained for the simulated lifetime of the (proto)star.
In contrast, in the presence of radiation pressure, the gravitational binding radius was rapidly surpassed for all mass cases. The simulation run 250-1.5-RAD exhibited a short, oscillatory gravitationally trapped phase from approximately 210 to 268 kyr after the initial launching of the H II region via rapid photoionization-driven R-type expansion. The subsequent expansion beyond this point is a pressure-driven D-type phase, which requires the additional outward force from radiation pressure to succeed, as we establish in this work.
At these early stages, the accretion luminosity dominates the total energy output, and fluctuations in the accretion rate (see the oscillatory period in Fig. 3) lead to corresponding changes in the ionizing photon flux, causing the H II region to expand and contract on short timescales. A sudden increase in the accretion rate can lead to a temporary drop in the ionizing photon flux reaching the outer parts of the H II region, as the dense infalling material absorbs photons close to the star. With the outward push from thermal and radiation pressure suddenly weakened, the constant inward forces of gravity and ram pressure temporarily dominate, causing the H II region to contract into a trapped state.
In the higher mass cases, the H II region quickly surpasses the binding radius, skipping the gravitational trapping phase seen in 250-1.5-RAD. This difference in trapping behavior arises from the different initial conditions of the models. The highermass runs begin with a higher average density, leading to a shorter collapse timescale and more rapid stellar evolution. Consequently, in these cases, the central star’s radiative feedback overpowers the gravity before a trapped state can be established, allowing the H II region to quickly surpass the binding radius. The ability to eventually overcome this trapping is directly linked to the increasing radiative feedback as the star grows. In Fig. 4, the ionizing photon rate (S*) in 500-1.5-RAD increases by several orders of magnitude, from approximately 1047 s−1 when the star is 10 M⊙ to over 1049 s−1 by the time the star reaches 20 M⊙. This increase in radiative feedback (photoionization feedback and radiation pressure) pushes the H II region beyond its binding radius and drives the subsequent expansion.
The outward boost from radiative feedback not only contributes to expansion but is required to prevent indefinite trapping within the hypercompact phase. This would suggest that radiation pressure may not be omitted from simulations of early massive star formation without losing significant realism. Moreover, H II regions observed in the hypercompact phase might be gravitationally trapped due to diminished radiation pressure.
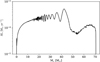 |
Fig. 3 Accretion rate (Ṁ*) onto the protostar as a function of stellar mass for the representative 500 M⊙ simulation (run #2). |
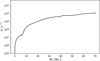 |
Fig. 4 Ionizing photon rate (S*) as a function of stellar mass for the representative 500 M⊙ simulation (run #2). |
3.2 Ram pressure trapping
While the gravitational trapping phase was short to nonexistent in the presence of radiation pressure, an additional trapped phase occurred beyond rbinding due to the ram pressure of infalling gas. In all three mass cases with radiation pressure, there was at least a short trapped phase due to ram pressure when rHII was approximately 1000 au. These phases appear in Fig. 5 as interruptions in expansion beyond rbinding. The simulation run 250-1.5-RAD experienced the least amount of ram pressure trapping, with only a brief slowing of expansion at 268 kyr (M* ≈ 14M⊙) when the H II region was around 650 au in extent. Because the initial reservoir was the smallest, there was less infalling gas and momentum to apply ram pressure compared to the higher mass cases.
The simulation run 500-1.5-RAD demonstrated the most distinct trapped phase, remaining stalled with rHII ≈ 717 au from 154 kyr (M* ≈ 18M⊙) to 225 kyr (M* ≈ 35 M⊙). Note that during the same time frame, rbinding ≈ 73 au, so the influence of the (proto)stellar gravity on the H II region had been well surpassed, leaving ram pressure to dominate.
The simulation runs 500-1.5-NORAD and 1000-1.5-NORAD also exhibited ram pressure trapping despite simultaneous gravitational trapping, which constrained the H II region within rbinding. In 500-1.5-NORAD, after the onset of photoionization expansion, the H II region rapidly expanded to rbinding.
At the H II region’s maximum extent on the central axis, it remained at rbinding for the duration of the simulation. On the central axis, however, the H II region expanded to rbinding but then experienced an oscillatory phase when the (proto)star was approximately 25M⊙.
Similarly, in 1000-1.5-NORAD (the blue line in the rightmost panel of Fig. 5) at the onset of photoionization expansion, the ionized gas boundary quickly approached rbinding. However, the boundary at the central axis was just as quickly pushed back down from 45 au to 3.5 au, nearly the same level as before the initial burst of expansion. The boundary then slowly climbed back up to rbinding, from 96 to 158 kyr. This long staggered climb clearly contrasts against 500-1.5-RAd or 1000-1.5-RAD as well as 250-1.5-NORAD, in which smooth and rapid expansion immediately reached or surpassed rbinding.
Given that ram pressure is the only physical process other than gravity directed toward the origin, the fact that rHII was pushed well below rbinding on the central axis instead of being kept at rbinding indicates that ram pressure from the infalling gas along the central axis must also have pushed the boundary back toward the (proto)star. Furthermore, the oscillatory nature of these stalled phases is well in agreement with observational studies such as Galván-Madrid et al. (2008), which describes an HCH II region unexpectedly contracting over very short timescales and proposes gravitational trapping and accretion as possible causes.
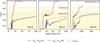 |
Fig. 5 HII region extent with (magenta) and without (blue) radiation pressure switched on in the Mcore = 250 M⊙ (runs #0, #5; left panel), 500 M⊙ (runs #2, #6; middle panel), and 1000 M⊙ (runs #4, #7; right panel) cases. |
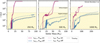 |
Fig. 6 Comparison of the H II region radius on the central axis rHII,z (solid lines) with the maximum H II region radius away from the central star rHII (dotted lines) for the three initial mass cases and with radiation pressure on and off (same numbers as ran in Fig. 5). |
Lifetimes of hypercompact and ultracompact phases for all simulations.
3.3 Lifetimes
We define the HCHII lifetime as the total time from when rHII is 100 au to when it crosses the hypercompact boundary at 2000 au (0.01 pc). The UCHII lifetime includes the HCH II lifetime, and thus it represents the total time required to progress from 100 au to 20000 au (0.1 pc).
In Table 2, we show the HCH II and UCH II lifetimes of all simulations. In the cases with radiation pressure and a density profile with βρ = −1.5, the UCH II lifetimes were 101.3 kyr, 164.2 kyr, and 160.5 kyr for the 250M⊙, 500M⊙, and 1000 M⊙ cases, respectively. These lifetimes on the order of 105 years fit within the observational lifetimes suggested by works such as Mottram et al. (2011). In case 250-1.5-RAD, the HCH II lifetime was extended both by an oscillatory gravitationally trapped phase and a brief ram pressure trapped phase. The cases with 500-1.5-RAD and 1000-1.5-RAD did not experience notable gravitational trapping but experienced extended stalling via ram pressure. In particular, 500-1.5-RAD experienced the most trapping in the hypercompact phase, while 1000-1.5-RAD experienced growth staggered by short trapped phases throughout the hypercompact and ultracompact phases. All cases with βρ = −1.5 also displayed periods of contraction. Not only did stalling slow H II region growth, but the boundary of the ionized gas was actually forced back. (See case 1000-1.5-RAD in the right panel of Fig. 5 at 40 M⊙ (122 kyr) for an example of rHII decreasing due to ram pressure.)
The cases without radiation pressure remained gravitationally trapped within the HCH II phase for the entirety or the vast majority of the simulation time. The cases with the initial density profile of βρ = −2.0, with initial mass concentrated closer to the star, experienced rapid and uninterrupted expansion that resulted in much shorter lifetimes on the order of 104 years.
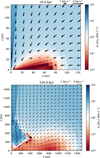 |
Fig. 7 Velocity before and after H II region expansion began in run #2. The background shows the ratio between radial and azimuthal velocity. Arrows indicate the velocity field in the xz plane. Note the presence of the torus, shown in red, where the magnitude of azimuthal velocity exceeds that of radial velocity, demonstrating the dominance of centrifugal force in particular regions on small scales relative to the whole cloud. |
3.4 Morphology and centrifugal force
We describe case 500-1.5-RAD here as a representative example of the morphological evolution seen in all simulations with radiation pressure. The gravitational collapse of the initial gas cloud leads to the formation of an optically thick, rotating accretion disk on scales of hundreds of au. The formation of this disk impedes infall along the midplane, shaping the environment into which the H II region later expands. The presence of this dense, optically thick disk is the primary reason the H II region assumes its characteristic “butterfly wing” morphology. Unable to expand through the disk, the ionized gas is instead channeled into two lobes perpendicular to it, creating the observed shape.
Torus formation (|υr| < |υφ|) began very early (around 300 years) at the inner simulation domain boundary. Over the next 30 kyr the torus grew to around 100 au. The top panel of Fig. 7 shows the state of the torus at this tim, before the onset of photoionization. By 50 kyr, the torus had become an accretion disk (υφ = υKepler) with an extent of 300 au. The disk continued to grow until 100 kyr, reaching a maximum extent of 1000 au.
The optically thick interior of the accretion disk prevented ionizing radiation from entering the disk region. The disk thus acted as a boundary for the H II region along the midplane. As can be seen in the bottom panel of Fig. 7, a boundary formed where the H II region expanded outward along the top edge of the disk. Infalling nutral material collided with the H II region boundary and was then diverted into the disk, applying ram pressure to the outer edge of the ionized region.
The H II region itself underwent interesting morphological changes as it grew. Figure 8 shows the morphology of the H II region at different points in time from 120 kyr to 300 kyr, with the presence of the disk visibly dictating which direction the ionized region could expand. Note that the flow of gas from the envelope into the accretion disk constrains the H II region along the midplane at radii even beyond the edge of the disk. From 120 kyr to 190 kyr, the H II region expanded as a lobe around the central axis. At 190 kyr, this lobe had broadened, and a protrusion began to form along the side of the lobe adjacent to the disk, pushed outward by thermal expansion pressure, radiation pressure, and centrifugal force. At 210 kyr, the protrusion had become much more pronounced, and by 300 kyr, the lobe had entirely separated from the central axis, forming a distinct wing structure (as seen in 2D). The wing structure was maintained until the H II region reached the edge of the simulation domain. This shape also demonstrates the difference between rHII and rHII,z, as the “wing tip” represents the maximum extent of the H II region away from the origin (rHII), while the extent of the ionized region along the central axis (rHII, z) lags behind (see Fig. 1 where this distinction is labeled).
Throughout our simulations, this morphology and structure is clearly visible in the neighborhood of the star due to the assumed axial symmetry and idealized initial conditions, particularly the lack of initial turbulence. The effect would likely be less pronounced in nature. Nonetheless, these morphologies provide the opportunity to analyze the influence of centrifugal force on the growth of the H II region by comparing the H II region extent along the z-direction (where the centrifugal force is zero) with its maximum extent relative to the origin.
 |
Fig. 8 Morphology of the HII region during the early and middle stages of growth in run #2. The white contour line indicates the boundary of the H II region. Note that the scale increases with each panel. The dashed gray line is the gravitational binding radius. |
3.5 Initial reservoir mass and density profile
As the initial reservoir mass increased, the onset of photoionization occurred earlier. Each mass case exhibited similar phases of cloud collapse, disk formation, H II region formation, and stellar evolution, but each step occurred more quickly in the 1000 M⊙ case than in the 500 M⊙ case and than in the 250 M⊙ case.
In the cases with the density profile where βρ = −2.0, meaning that the initial mass was distributed closer to the origin, gravitational collapse proceeded much more rapidly than in the corresponding mass cases where βρ = −1.5. Additionally, the initially lower mass on large scales resulted in lower ram pressure against the H II region growth later on in evolution. No gravitational or ram pressure trapping occurred in the 250 M⊙ case, and only some brief oscillations occurred due to gravitational trapping in the 500 M⊙ case. We call attention to the faster, uninterrupted expansion of the βρ = −2.0 cases shown in Fig. 9.
3.6 Limitations and future work
This work does not include magnetic fields, so magnetohydrodynamical (MHD) simulations would be a sensible progression. We also did not include a manual injection of protostellar outflows, purposefully, due to previous studies that showed no H II trapping in the presence of outflows. Our approach contrasts with that of Kuiper & Hosokawa (2018), in which it is assumed that the (injected) protostellar outflow does not stop during the starformation process. The injected outflows created large bipolar cavities, allowing for unhindered H II region expansion.
In this study, we consider the opposite limit, that is, the absence of protostellar outflows. As a result of this assumption, we obtained plausible scenarios for the trapping of H II regions. Given the observational evidence for both limits to the growth of H II regions (see Sect. 1) and considering the formation of magnetically driven jets (Moscadelli et al. 2022) before photoionization in nature, this altogether may suggest that magnetically driven jets and outflows have a limited lifetime (see Oliva & Kuiper 2023, for a discussion on how such outflows can be terminated by magnetic braking) such that they do not impact the eventual growth of H II regions.
We propose that the entire H II region lifetime may occur (with trapped phases) in systems that never experience outflows or after magnetic forces have died down and the launching of jets and outflows has ended. There could be enough time in the early lives of massive stars for both a magnetically dominated phase characterized by outflows or jets followed by a phase of H II region expansion. Alternatively, there might be systems for which magnetically driven outflows are too weak or intermittent, leading to trapping. Future works should examine this question in more detail by including MHD modeling of the flow that allows for the self-consistent launching of protostellar outflows.
Line-driven stellar winds were also not included, which could have had an effect on accretion rates (see Kee & Kuiper 2019). Ideally, future simulations would also include line-driven feedback, which impacts disk ablation and stellar wind feedback.
Naturally, these simulations are limited by being two dimensional. We assumed axial and midplane symmetry to approximate the 3D nature of the system. Observationally, asymmetric structures such as spiral arms, fragments, and clumps occur. The rotational symmetry of the disk is thus also assumed, which influences the overall morphology of the system. Future simulations would ideally simulate a full 3D domain with no assumptions on symmetry, though this would of course require significantly greater computational resources and time. Geen et al. (2023) provides one such 3D simulation, which utilized a much larger box-shaped grid. They included MHD and stellar winds and focused primarily on later stages of massive star formation at larger scales than this work.
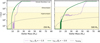 |
Fig. 9 H II region extent in the 250 M⊙ (left) and 500 M⊙ (right) cases comparing initial density profiles of βρ = −1.5 (lavender: runs #0 and #2) and βρ = −2.0 (green: runs #1 and #3). |
4 Conclusion
We performed radiative-hydrodynamics simulations to explore the roles of (proto)stellar gravity, ram pressure from infalling gas, radiation pressure, and centrifugal forces in stalling and supporting early H II region growth. The simulations exhibited the formation of an accretion disk and the evolution of an H II region. We find that H II region lifetimes in the hypercompact and ultracompact phases could be extended by both early gravitational trapping at small scales and later ram pressure trapping at larger scales.
In the absence of radiation pressure, the gravitationally trapped phase lasted indefinitely. These H II regions were thus in the hypercompact phase for the duration of the simulation. In contrast, in the presence of radiation pressure, both early gravitational trapping at small radii and later ram pressure trapping at large radii occurred. Together, gravitational trapping and ram pressure trapping significantly stalled the H II region growth via phases in which minimal growth or even contraction occurred. These fluctuations in H II region radius agree with observational reports that describe decreases in UCHII and HCHII region size over short timescales, such as in Galván-Madrid et al. (2008). The resulting lifetimes of the hypercompact and ultracompact phases are roughly in accordance with observations. This suggests that these physical mechanisms are key to lengthening the duration of the compact phases.
Furthermore, we tested two initial density profiles, one in which the reservoir mass was distributed with a higher density closer to the origin (βρ = −2.0) than the other (βρ = −1.5). The centrally concentrated density profile resulted in a shorter collapse and H II region growth timescale with no trapping, skipping immediately past the compact phases.
We acknowledge the limitations set by the axial and midplane symmetry. We suggest that future work should ideally be full 3D and include magnetic fields.
Acknowledgements
RK acknowledges financial support via the Heisenberg Research Grant funded by the Deutsche Forschungsgemeinschaft (DFG, German Research Foundation) under grant no. KU 2849/9, project no. 445783058.
References
- Arthur, S. J., & Hoare, M. 2006, ApJS, 165, 283 [NASA ADS] [CrossRef] [Google Scholar]
- Ball, R., Meixner, M. M., Keto, E., Arens, J. F., & Jernigan, J. G. 1996, AJ, 112, 1645 [Google Scholar]
- Bally, J., Snell, R. L., & Predmore, R. 1983, ApJ, 272, 154 [Google Scholar]
- Beltrán, M., Cesaroni, R., Rivilla, V., et al. 2018, A&A, 615, A141 [NASA ADS] [CrossRef] [EDP Sciences] [Google Scholar]
- Beuther, H., Schneider, N., Simon, R., et al. 2022, A&A, 659, A77 [NASA ADS] [CrossRef] [EDP Sciences] [Google Scholar]
- Beuther, H., Gieser, C., Soler, J. D., et al. 2024, A&A, 682, A81 [NASA ADS] [CrossRef] [EDP Sciences] [Google Scholar]
- Cesaroni, R., Pestalozzi, M., Beltrán, M. T., et al. 2015, A&A, 579, A71 [NASA ADS] [CrossRef] [EDP Sciences] [Google Scholar]
- Cesaroni, R., Beltrán, M., Moscadelli, L., Sánchez-Monge, Á., & Neri, R. 2019, A&A, 624, A100 [NASA ADS] [CrossRef] [EDP Sciences] [Google Scholar]
- Comeron, F., & Torra, J. 1996, A&A, 314, 776 [Google Scholar]
- De Pree, C., Peters, T., Mac Low, M.-M., et al. 2014, ApJ, 781, L36 [NASA ADS] [CrossRef] [Google Scholar]
- De Pree, C., Galván-Madrid, R., Goss, W., et al. 2018, ApJ, 863, L9 [NASA ADS] [CrossRef] [Google Scholar]
- Draine, B. T. 2011, Physics of the Interstellar and Intergalactic Medium, 19 (Princeton University Press) [Google Scholar]
- Franco-Hernández, R., & Rodríguez, L. F. 2004, ApJ, 604, L105 [CrossRef] [Google Scholar]
- Galván-Madrid, R., Rodríguez, L. F., Ho, P. T. P., & Keto, E. 2008, ApJ, 674, L33 [CrossRef] [Google Scholar]
- Gaume, R., Goss, W., Dickel, H., Wilson, T., & Johnston, K. 1995, ApJ, 438, 776 [NASA ADS] [CrossRef] [Google Scholar]
- Geen, S., Bieri, R., De Koter, A., Kimm, T., & Rosdahl, J. 2023, MNRAS, 526, 1832 [NASA ADS] [CrossRef] [Google Scholar]
- Gieser, C., Beuther, H., Semenov, D., et al. 2022, A&A, 657, A3 [CrossRef] [EDP Sciences] [Google Scholar]
- Guzman, A., Garay, G., Rodriguez, L. F., & Contreras, Y. 2014, ATNF Proposal, C3006 [Google Scholar]
- Hosokawa, T., & Omukai, K. 2009, ApJ, 691, 823 [Google Scholar]
- Israel, F. 1978, A&A, 70, 769 [Google Scholar]
- Kahn, F. 1954, Bull. Astron. Inst. Netherlands, 12, 187 [NASA ADS] [Google Scholar]
- Kalcheva, I., Hoare, M., Urquhart, J., et al. 2018, A&A, 615, A103 [NASA ADS] [CrossRef] [EDP Sciences] [Google Scholar]
- Kee, N. D., & Kuiper, R. 2019, MNRAS, 483, 4893 [NASA ADS] [CrossRef] [Google Scholar]
- Keto, E. 2002, ApJ, 568, 754 [NASA ADS] [CrossRef] [Google Scholar]
- Keto, E. 2003, ApJ, 599, 1196 [NASA ADS] [CrossRef] [Google Scholar]
- Klaassen, P., Wilson, C., Keto, E., & Zhang, Q. 2009, ApJ, 703, 1308 [Google Scholar]
- Klaassen, P., Johnston, K., Urquhart, J., et al. 2018, A&A, 611, A99 [NASA ADS] [CrossRef] [EDP Sciences] [Google Scholar]
- Kuiper, R., & Hosokawa, T. 2018, A&A, 616, A101 [NASA ADS] [CrossRef] [EDP Sciences] [Google Scholar]
- Kuiper, R., Klahr, H., Beuther, H., & Henning, T. 2010, ApJ, 722, 1556 [NASA ADS] [CrossRef] [Google Scholar]
- Kuiper, R., Yorke, H. W., & Mignone, A. 2020, ApJS, 250, 13 [Google Scholar]
- Kurtz, S. 2000, Rev. Mex. Astron. Astrofís., 9, 169 [Google Scholar]
- Kurtz, S. 2005, Proc. Int. Astron. Union, 1, 111 [Google Scholar]
- Laor, A., & Draine, B. T. 1993, ApJ, 402, 441 [NASA ADS] [CrossRef] [Google Scholar]
- Maud, L., Cesaroni, R., Kumar, M., et al. 2018, A&A, 620, A31 [NASA ADS] [CrossRef] [EDP Sciences] [Google Scholar]
- Mignone, A., Bodo, G., Massaglia, S., et al. 2007, ApJS, 170, 228 [Google Scholar]
- Mignone, A., Flock, M., Stute, M., Kolb, S., & Muscianisi, G. 2012, A&A, 545, A152 [NASA ADS] [CrossRef] [EDP Sciences] [Google Scholar]
- Moscadelli, L., Rivilla, V., Cesaroni, R., et al. 2018, A&A, 616, A66 [NASA ADS] [CrossRef] [EDP Sciences] [Google Scholar]
- Moscadelli, L., Sanna, A., Beuther, H., Oliva, A., & Kuiper, R. 2022, Nat. Astron., 6, 1068 [NASA ADS] [CrossRef] [Google Scholar]
- Mottram, J. C., Hoare, M. G., Davies, B., et al. 2011, ApJ, 730, L33 [Google Scholar]
- Oey, M. S., Parker, J. S., Mikles, V. J., & Zhang, X. 2003, AJ, 126, 2317 [NASA ADS] [CrossRef] [Google Scholar]
- Oliva, A., & Kuiper, R. 2023, A&A, 669, A81 [NASA ADS] [CrossRef] [EDP Sciences] [Google Scholar]
- Peters, T., Banerjee, R., Klessen, R. S., et al. 2010, ApJ, 711, 1017 [NASA ADS] [CrossRef] [Google Scholar]
- Sollins, P. K., Zhang, Q., Keto, E., & Ho, P. T. 2005, ApJ, 624, L49 [NASA ADS] [CrossRef] [Google Scholar]
- Tenorio-Tagle, G. 1979, A&A, 71, 59 [NASA ADS] [Google Scholar]
- Urquhart, J., Thompson, M., Moore, T., et al. 2013, MNRAS, 435, 400 [Google Scholar]
- Walmsley, M. 1995, in Revista Mexicana de Astronomia y Astrofisica Conference Series, 1, 137 [Google Scholar]
- Wood, D. O., & Churchwell, E. 1989, ApJS, 69, 831 [NASA ADS] [CrossRef] [Google Scholar]
- Yang, A., Urquhart, J., Thompson, M., et al. 2021, A&A, 645, A110 [NASA ADS] [CrossRef] [EDP Sciences] [Google Scholar]
Appendix A Additional figure
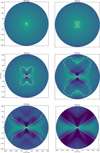 |
Fig. A.1 Morphology of the expanding H II region at large scales with density in the background. The contour defined by the white line indicates the boundary of the H II region, within which > 50% of hydrogen was ionized. Snapshots were taken from run #2 (500-1.5-RAD). The color map is shared with Fig. 1. |
All Tables
All Figures
|
Fig. 1 Example snapshot of typical H II region “butterfly wing” morphology, taken from run #0 in this work, as a density color map. The boundary depicted with the white outline is the region where more than 50% of the hydrogen was ionized. |
| In the text | |
|
Fig. 2 Cloud at the start of the simulation before collapse, displayed in 3D. The rotation and the midplane are indicated. |
| In the text | |
|
Fig. 3 Accretion rate (Ṁ*) onto the protostar as a function of stellar mass for the representative 500 M⊙ simulation (run #2). |
| In the text | |
|
Fig. 4 Ionizing photon rate (S*) as a function of stellar mass for the representative 500 M⊙ simulation (run #2). |
| In the text | |
|
Fig. 5 HII region extent with (magenta) and without (blue) radiation pressure switched on in the Mcore = 250 M⊙ (runs #0, #5; left panel), 500 M⊙ (runs #2, #6; middle panel), and 1000 M⊙ (runs #4, #7; right panel) cases. |
| In the text | |
|
Fig. 6 Comparison of the H II region radius on the central axis rHII,z (solid lines) with the maximum H II region radius away from the central star rHII (dotted lines) for the three initial mass cases and with radiation pressure on and off (same numbers as ran in Fig. 5). |
| In the text | |
|
Fig. 7 Velocity before and after H II region expansion began in run #2. The background shows the ratio between radial and azimuthal velocity. Arrows indicate the velocity field in the xz plane. Note the presence of the torus, shown in red, where the magnitude of azimuthal velocity exceeds that of radial velocity, demonstrating the dominance of centrifugal force in particular regions on small scales relative to the whole cloud. |
| In the text | |
|
Fig. 8 Morphology of the HII region during the early and middle stages of growth in run #2. The white contour line indicates the boundary of the H II region. Note that the scale increases with each panel. The dashed gray line is the gravitational binding radius. |
| In the text | |
|
Fig. 9 H II region extent in the 250 M⊙ (left) and 500 M⊙ (right) cases comparing initial density profiles of βρ = −1.5 (lavender: runs #0 and #2) and βρ = −2.0 (green: runs #1 and #3). |
| In the text | |
|
Fig. A.1 Morphology of the expanding H II region at large scales with density in the background. The contour defined by the white line indicates the boundary of the H II region, within which > 50% of hydrogen was ionized. Snapshots were taken from run #2 (500-1.5-RAD). The color map is shared with Fig. 1. |
| In the text | |
Current usage metrics show cumulative count of Article Views (full-text article views including HTML views, PDF and ePub downloads, according to the available data) and Abstracts Views on Vision4Press platform.
Data correspond to usage on the plateform after 2015. The current usage metrics is available 48-96 hours after online publication and is updated daily on week days.
Initial download of the metrics may take a while.