Open Access
Fig. A.1
Download original image
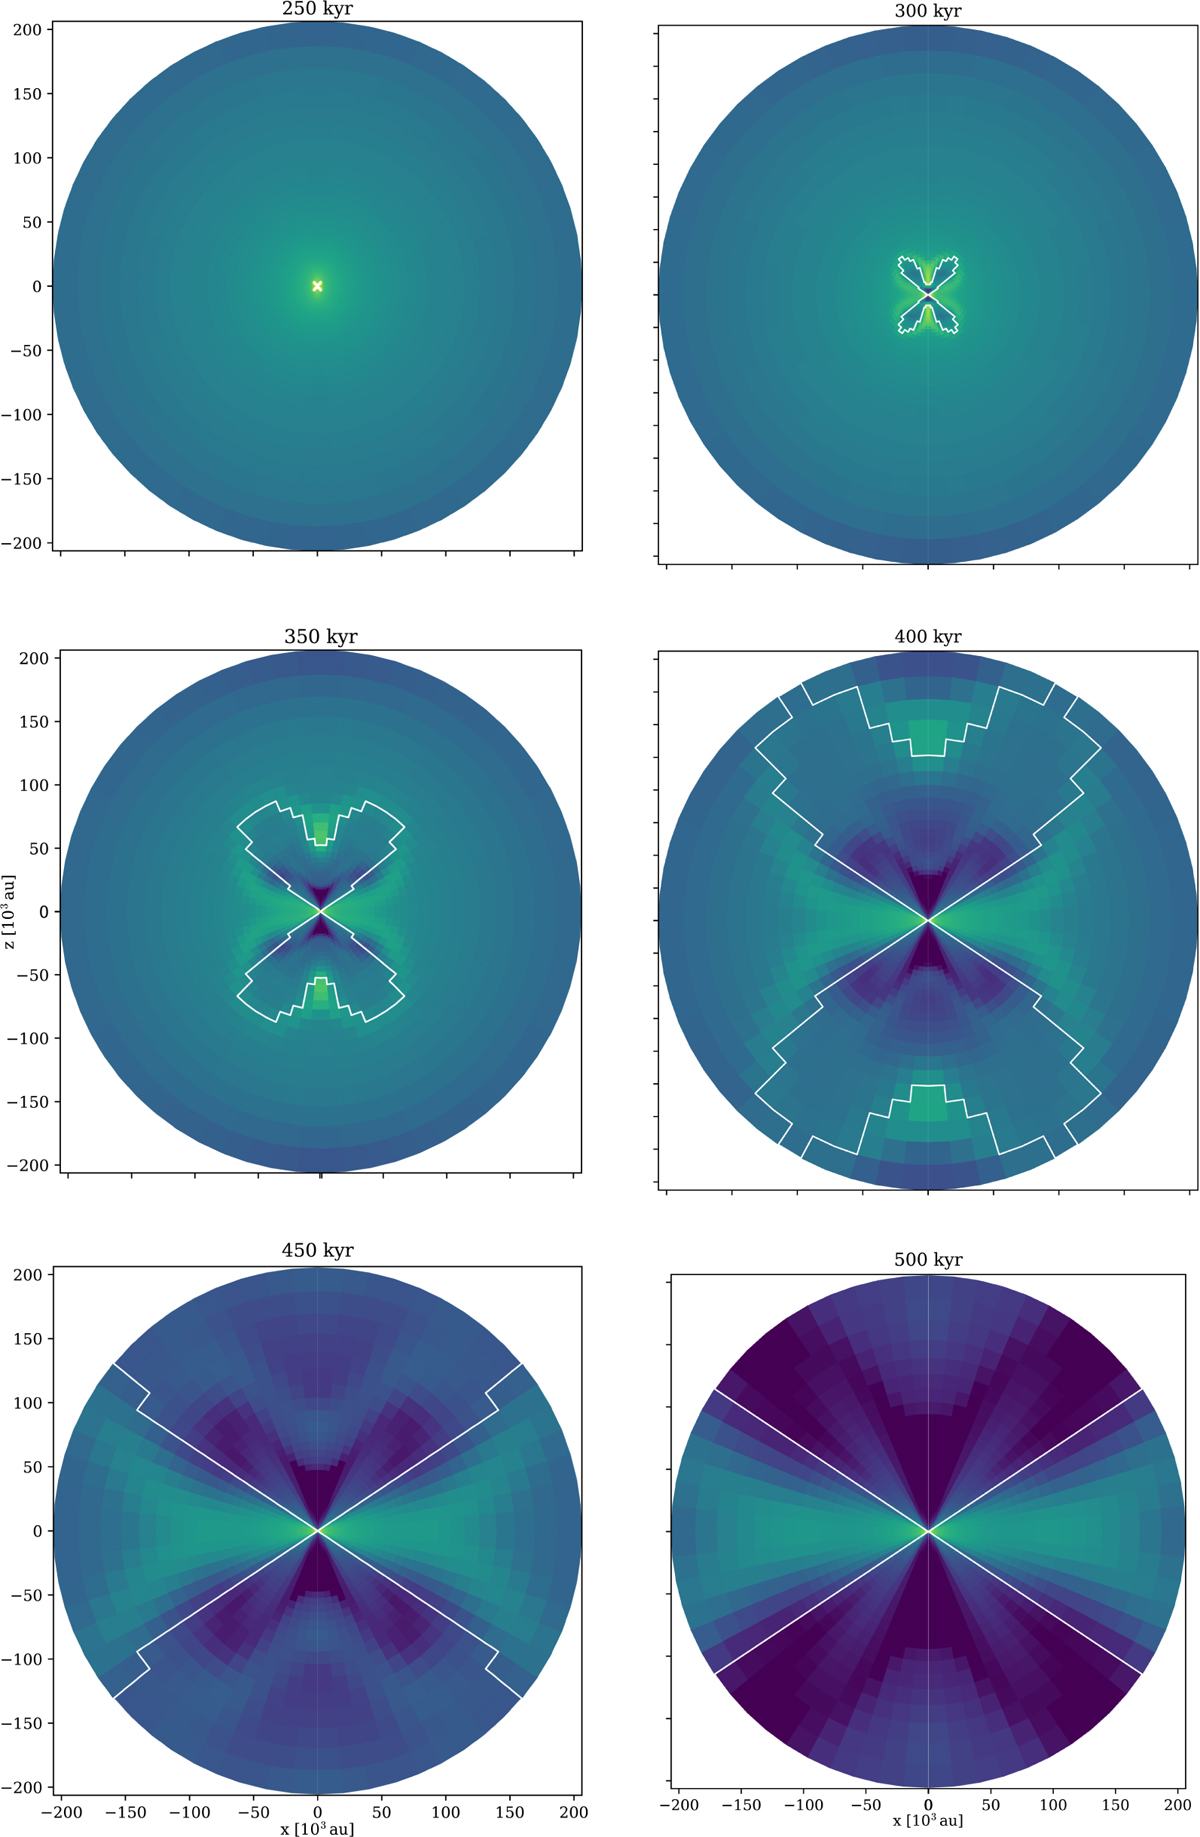
Morphology of the expanding H II region at large scales with density in the background. The contour defined by the white line indicates the boundary of the H II region, within which > 50% of hydrogen was ionized. Snapshots were taken from run #2 (500-1.5-RAD). The color map is shared with Fig. 1.
Current usage metrics show cumulative count of Article Views (full-text article views including HTML views, PDF and ePub downloads, according to the available data) and Abstracts Views on Vision4Press platform.
Data correspond to usage on the plateform after 2015. The current usage metrics is available 48-96 hours after online publication and is updated daily on week days.
Initial download of the metrics may take a while.