Fig. 7
Download original image
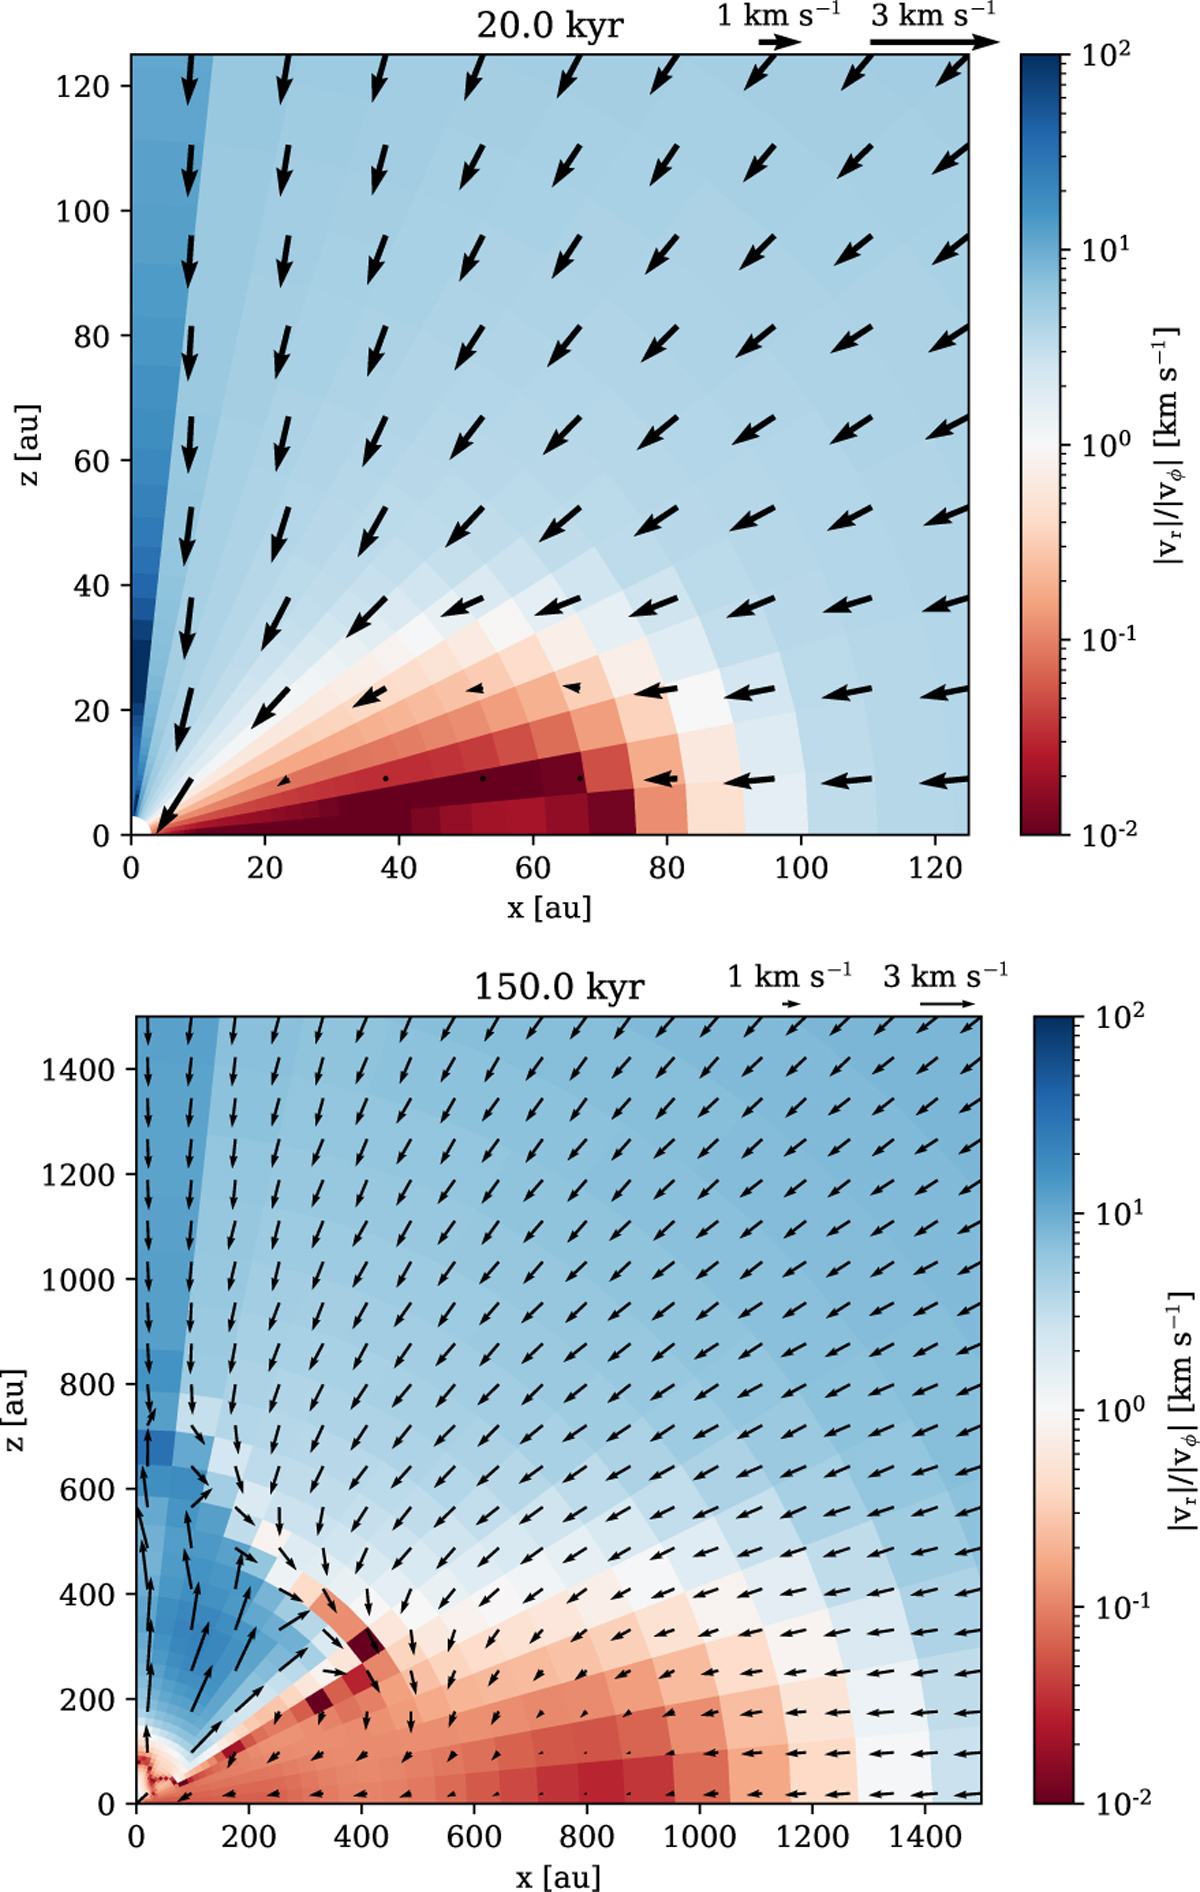
Velocity before and after H II region expansion began in run #2. The background shows the ratio between radial and azimuthal velocity. Arrows indicate the velocity field in the xz plane. Note the presence of the torus, shown in red, where the magnitude of azimuthal velocity exceeds that of radial velocity, demonstrating the dominance of centrifugal force in particular regions on small scales relative to the whole cloud.
Current usage metrics show cumulative count of Article Views (full-text article views including HTML views, PDF and ePub downloads, according to the available data) and Abstracts Views on Vision4Press platform.
Data correspond to usage on the plateform after 2015. The current usage metrics is available 48-96 hours after online publication and is updated daily on week days.
Initial download of the metrics may take a while.