Open Access
Fig. 8
Download original image
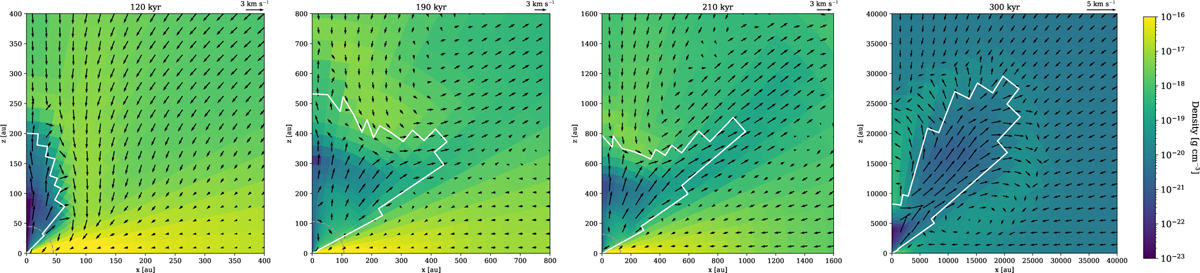
Morphology of the HII region during the early and middle stages of growth in run #2. The white contour line indicates the boundary of the H II region. Note that the scale increases with each panel. The dashed gray line is the gravitational binding radius.
Current usage metrics show cumulative count of Article Views (full-text article views including HTML views, PDF and ePub downloads, according to the available data) and Abstracts Views on Vision4Press platform.
Data correspond to usage on the plateform after 2015. The current usage metrics is available 48-96 hours after online publication and is updated daily on week days.
Initial download of the metrics may take a while.