Fig. 5
Download original image
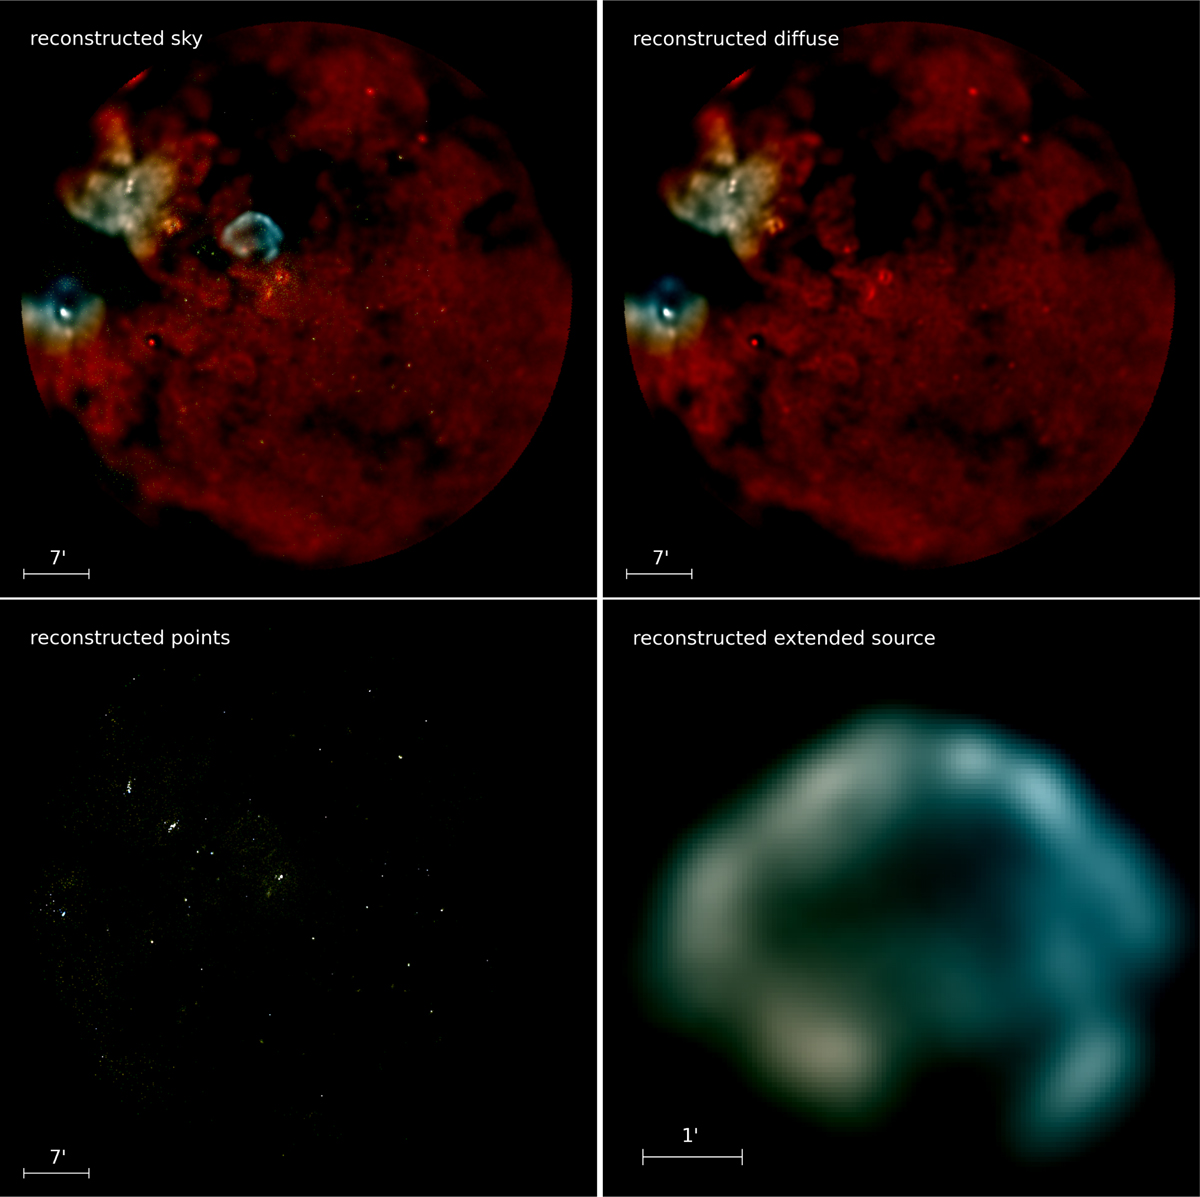
Posterior mean of the SN1987A reconstruction. The top panels display on the left the reconstruction of the sky and on the right the separated diffuse emission. The bottom panels display the reconstruction of the point-like emission (left) and a zoom into the reconstruction of the diffuse emission from 30 Doradus C (right) as marked in Fig. 1. We convolve the point sources with an unnormalized Gaussian kernel with standard deviation σ = 0.5, in order to make them visible on printed paper. The different colors represent the logarithmic intensities in the three energy channels 0.2–0.1 keV, 1.0–2.0 keV, and 2.0–4.5 keV and are depicted in red, green, and blue, respectively.
Current usage metrics show cumulative count of Article Views (full-text article views including HTML views, PDF and ePub downloads, according to the available data) and Abstracts Views on Vision4Press platform.
Data correspond to usage on the plateform after 2015. The current usage metrics is available 48-96 hours after online publication and is updated daily on week days.
Initial download of the metrics may take a while.