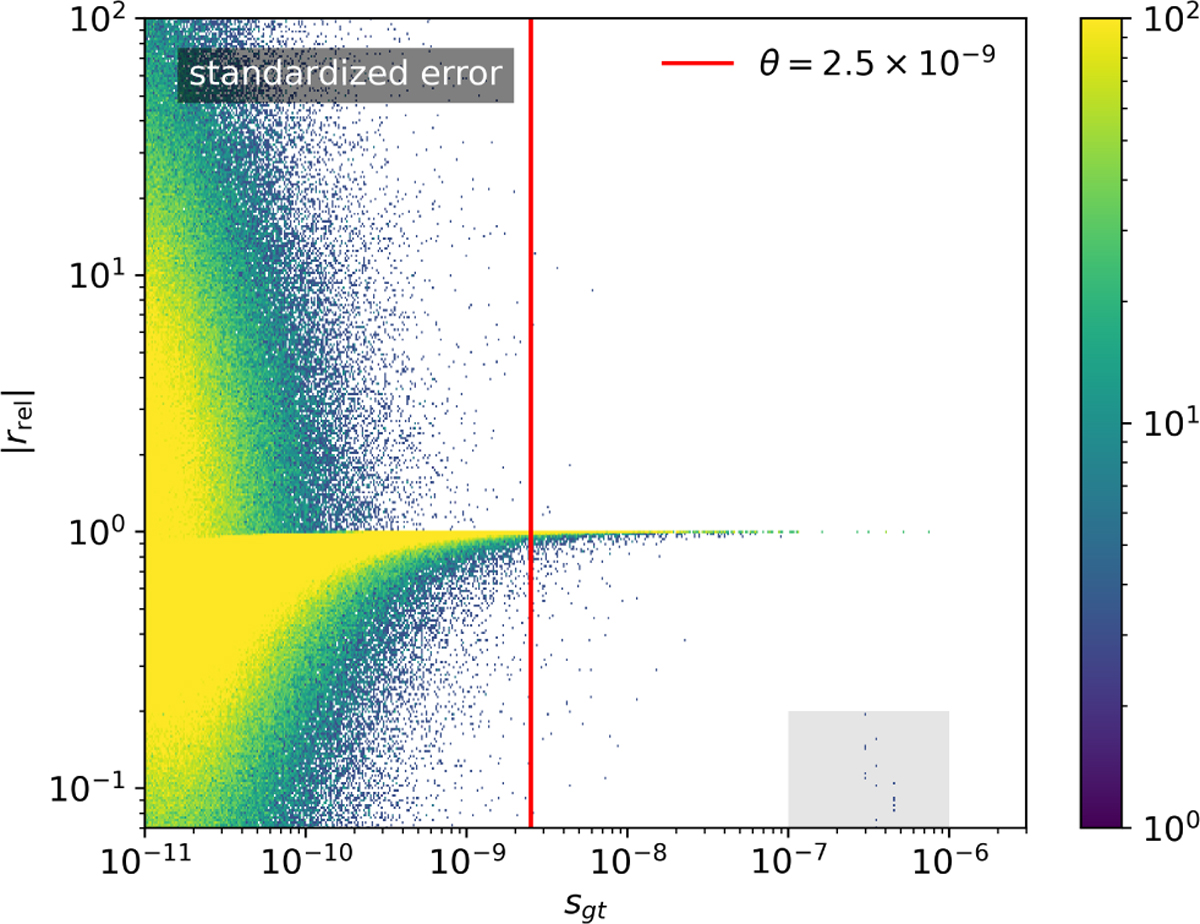
Fig. 7
Download original image
Two-dimensional histogram of the standardized error (Eq. (24)) for the point sources. The histogram is plotted together with the lowest detection threshold, θ = 2.5 × 10⁻⁹, calculated for the region with the longest observation time in Appendix C. The colorbar shows the counts per bin in the two-dimensional histogram, i.e., higher values correspond to more frequent combinations of standardized error and ground truth flux.
Current usage metrics show cumulative count of Article Views (full-text article views including HTML views, PDF and ePub downloads, according to the available data) and Abstracts Views on Vision4Press platform.
Data correspond to usage on the plateform after 2015. The current usage metrics is available 48-96 hours after online publication and is updated daily on week days.
Initial download of the metrics may take a while.