Fig. 8
Download original image
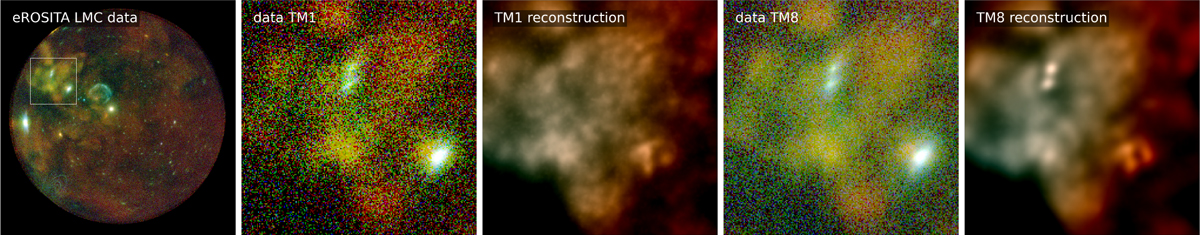
Zoom-in of the reconstruction of diffuse emission from the Tarantula Nebula. From left to right the panels show the zoom area on the plot of the eROSITA LMC data, the zoomed LMC data for TM1, the corresponding single-TM diffuse emission reconstruction for TM1, the zoomed data for all five TMs, and the diffuse emission reconstruction by means of all five observations.
Current usage metrics show cumulative count of Article Views (full-text article views including HTML views, PDF and ePub downloads, according to the available data) and Abstracts Views on Vision4Press platform.
Data correspond to usage on the plateform after 2015. The current usage metrics is available 48-96 hours after online publication and is updated daily on week days.
Initial download of the metrics may take a while.