Fig. 9
Download original image
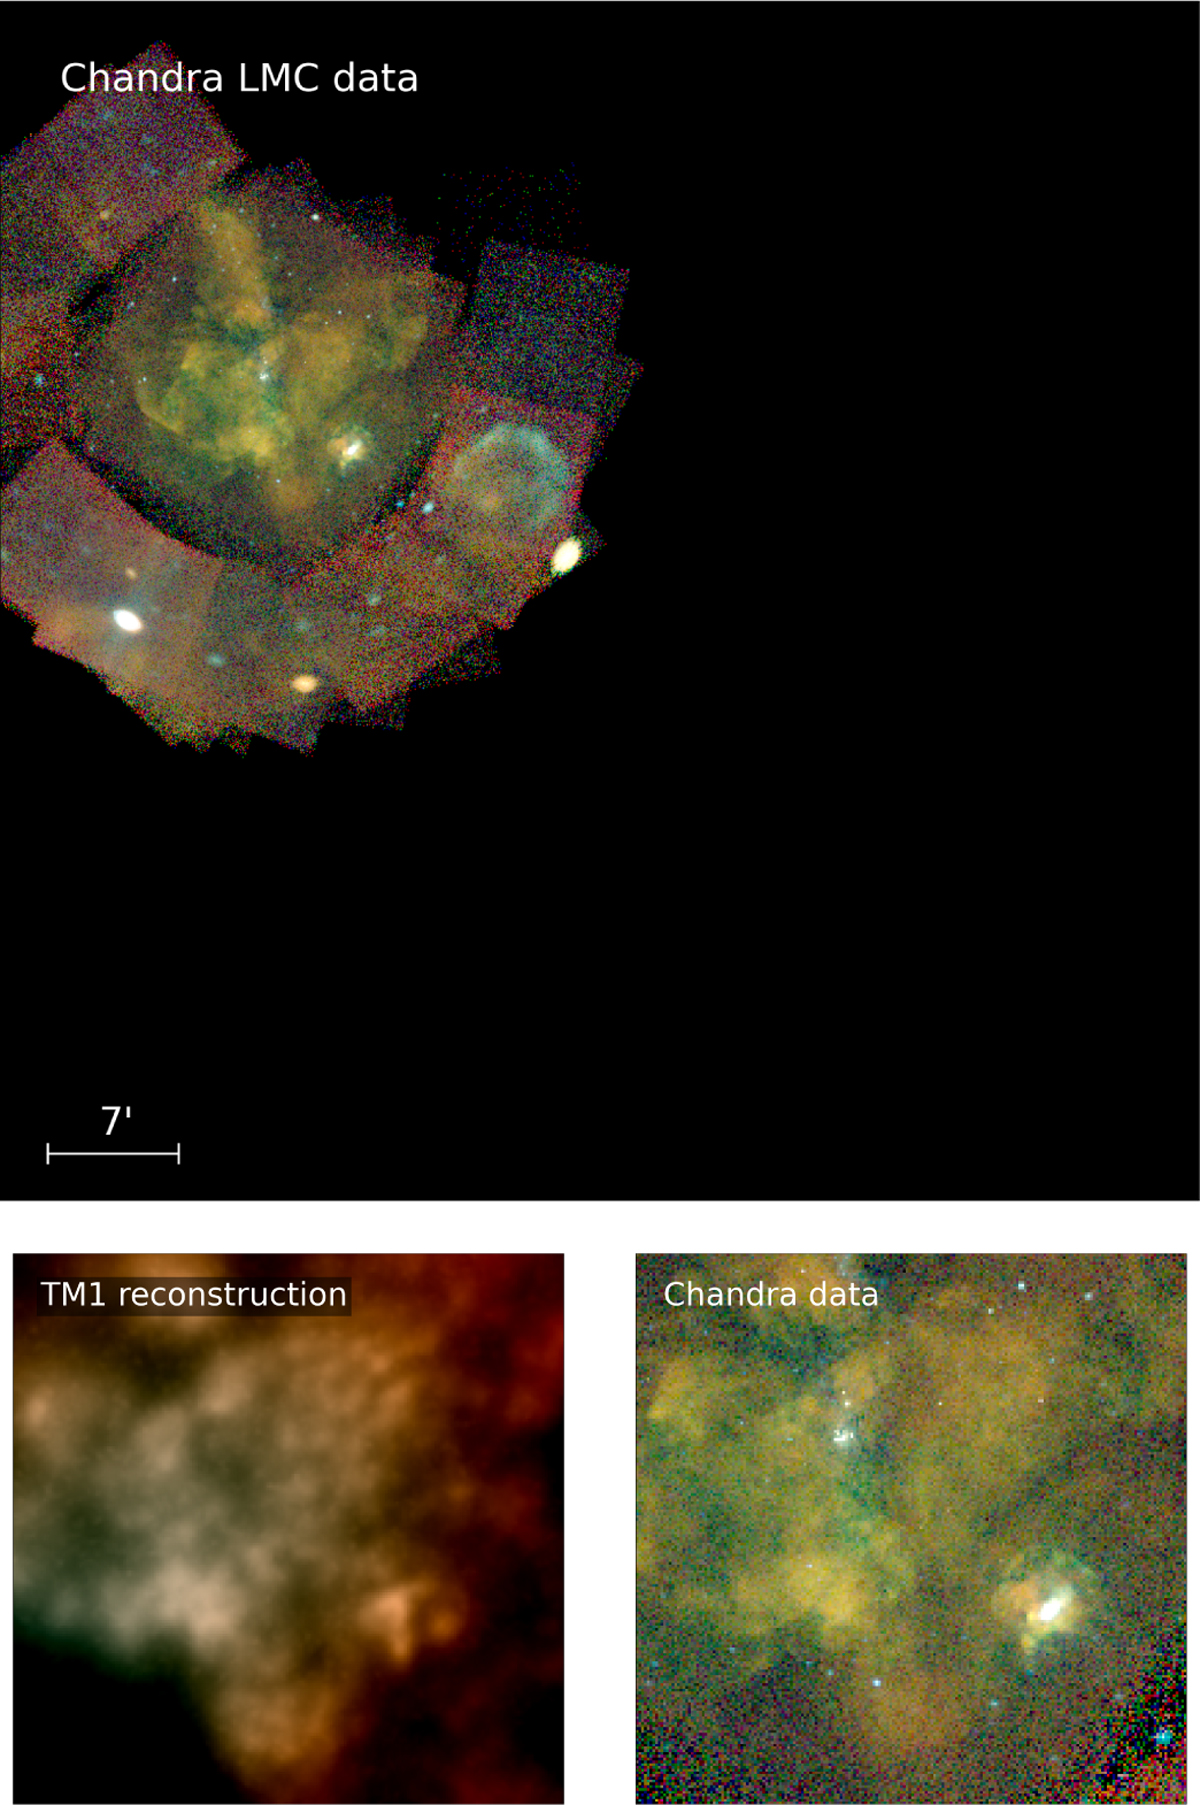
Chandra LMC data. The top panel shows Chandra data, as specified in Table B.1, in the region of the LMC. The bottom panels show the corresponding zoom-ins of our eROSITA reconstruction of the diffuse emission based on the data of TM1 and the Chandra data on the fine-scale structures of the Tarantula Nebula, as shown in Fig. 8.
Current usage metrics show cumulative count of Article Views (full-text article views including HTML views, PDF and ePub downloads, according to the available data) and Abstracts Views on Vision4Press platform.
Data correspond to usage on the plateform after 2015. The current usage metrics is available 48-96 hours after online publication and is updated daily on week days.
Initial download of the metrics may take a while.