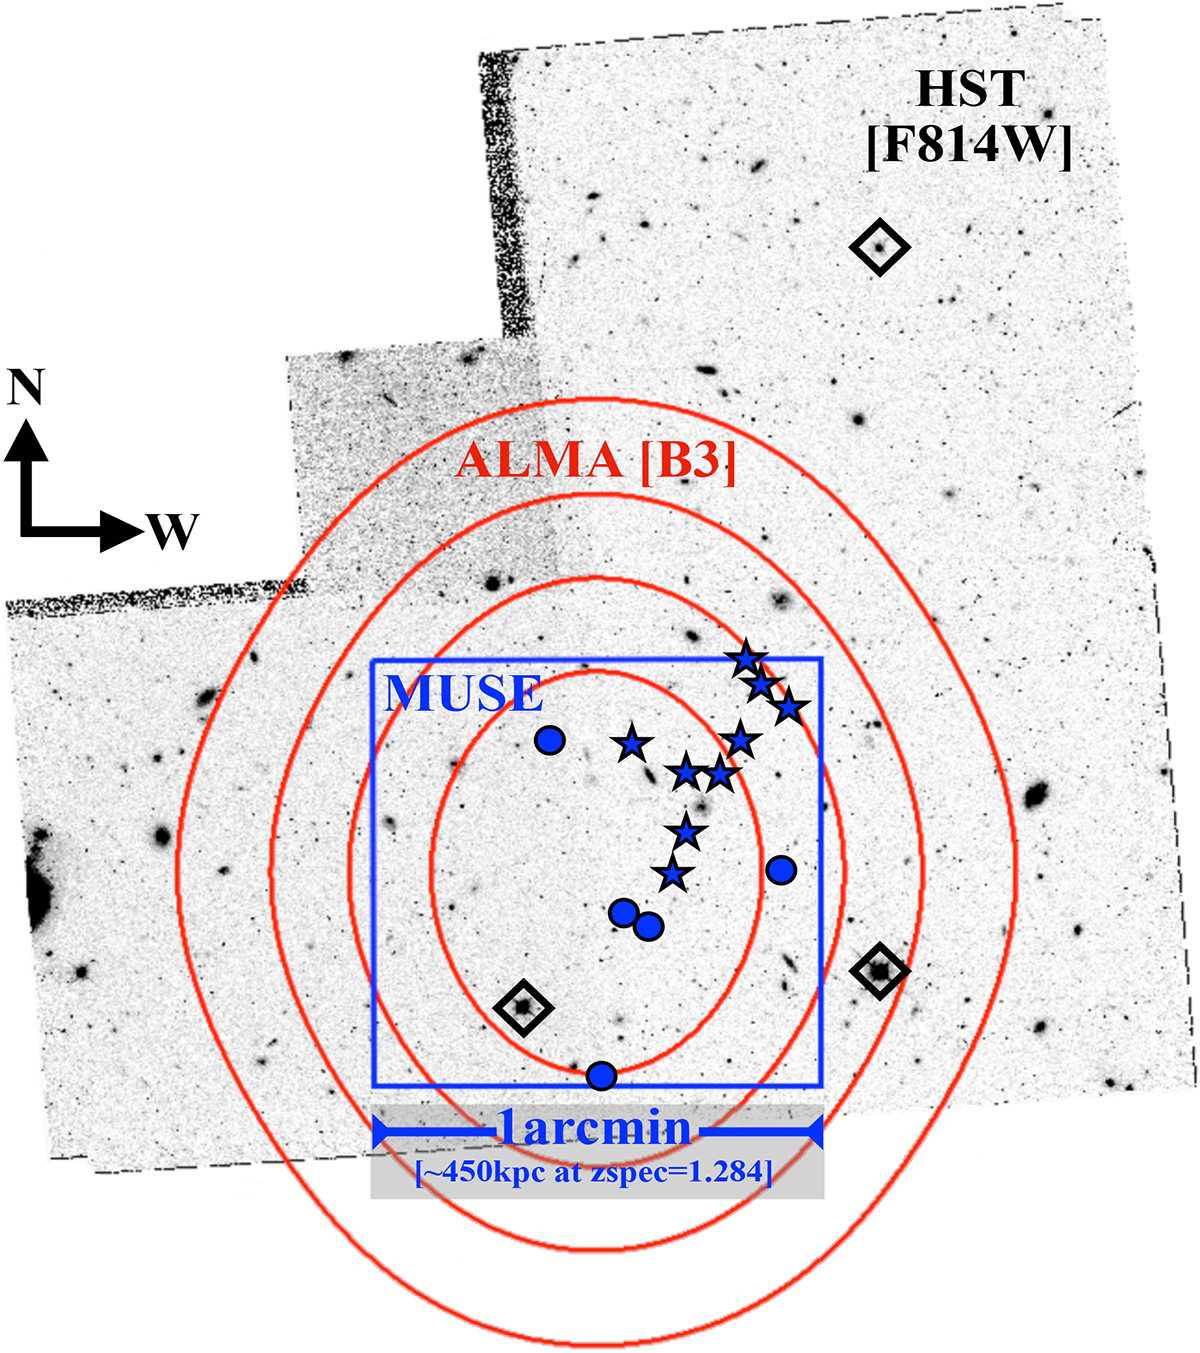
Fig. 1.
Download original image
Comparison of the ALMA coverage (red isocontours at primary beam attenuation levels of 0.8, 0.6, 0.4, and 0.2) with those of HDFS (WFPC2/F814W; background grey map) and MUSE3D (1 × 1 arcmin2 blue region). The blue stars and circles indicate the positions of the group members at zspec = 1.284 and 4.699, respectively (two of the high-redshift members lie too close to each other for their two circles to be distinguished). The HDFS imaging was aligned with Gaia-DR3 reference (Gaia Collaboration 2023) making use of three stars in the field (black diamonds) at RA, Dec = 22:32:50.513, −60:34:00.94 (used for the MUSE Slow Guiding System); 22:32:56.999, −60:34:05.82 (brightest star in the field); and 22:32:50.513, −60:32:18.83. The image is oriented such that north is up, and west is to the right.
Current usage metrics show cumulative count of Article Views (full-text article views including HTML views, PDF and ePub downloads, according to the available data) and Abstracts Views on Vision4Press platform.
Data correspond to usage on the plateform after 2015. The current usage metrics is available 48-96 hours after online publication and is updated daily on week days.
Initial download of the metrics may take a while.