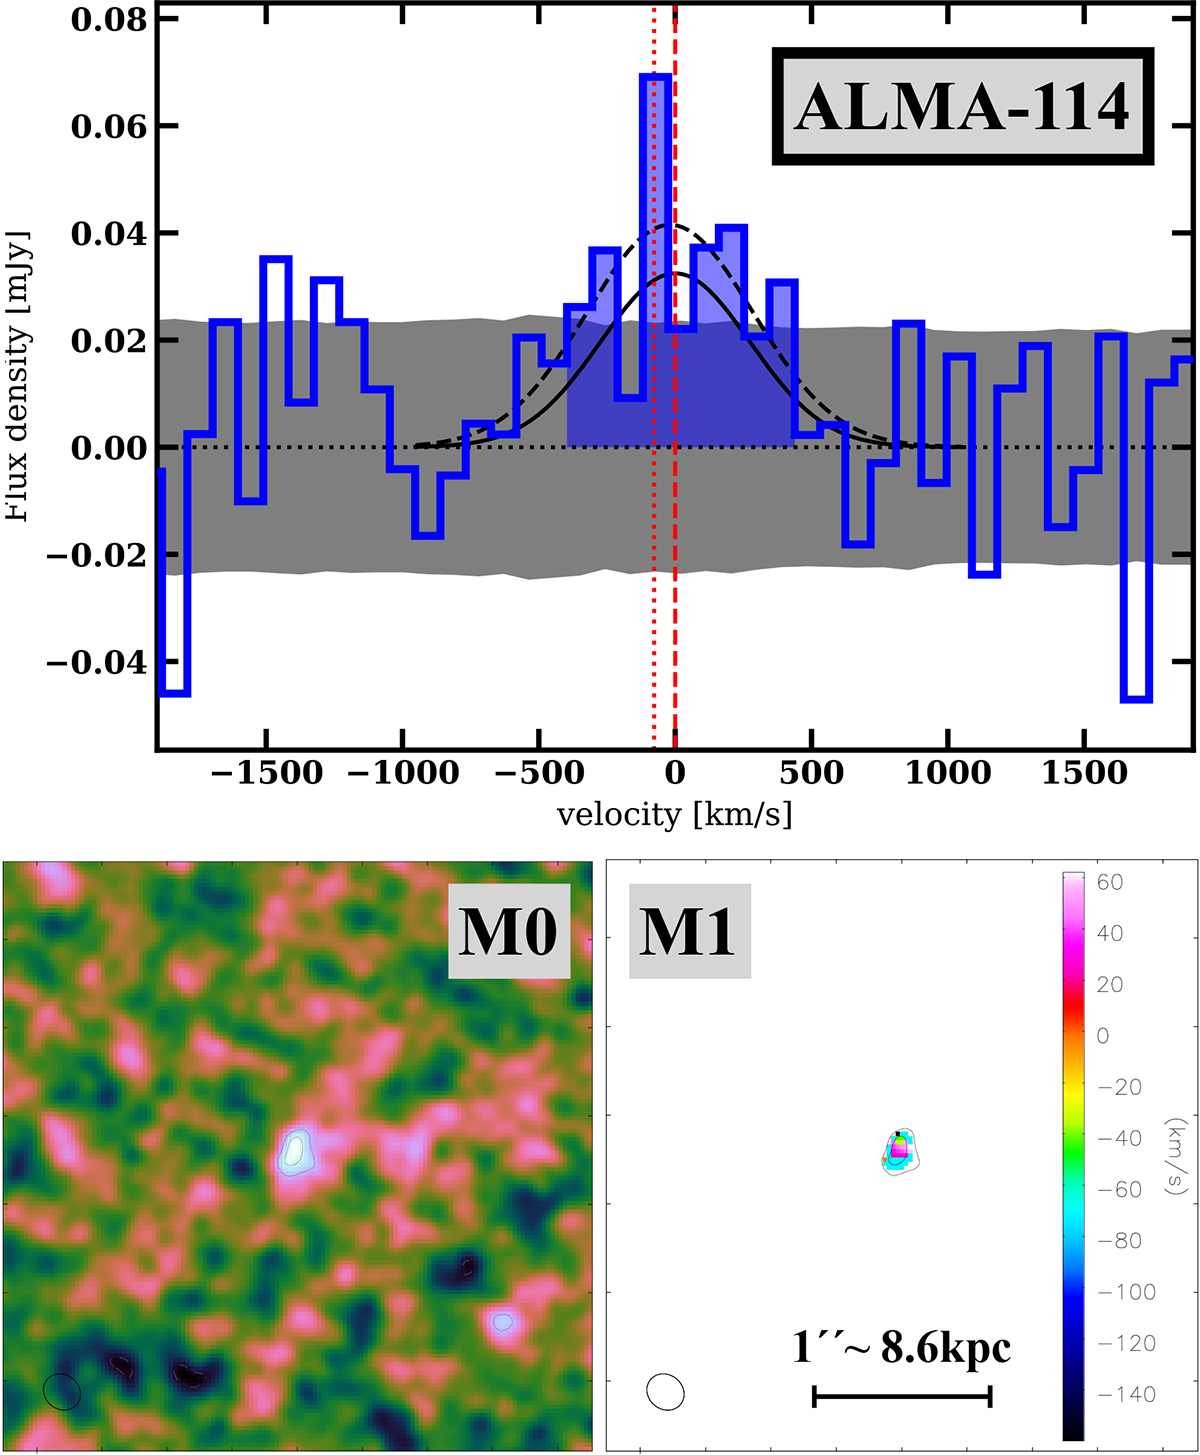
Fig. 10.
Download original image
Same as in Figure 5, but for ALMA-114. We detect no emission towards the location of B15-114, but in the north-east towards a source labelled ALMA-114 in this work. The moment-0 map (centred on the new source detection) shows a significant detection (S/N ∼ 6) associated with a broad CO (2-1) line detection, very close in redshift to B15-114 (indicated with the vertical dotted line in the spectrum). The lower S/N feature in the south-west of the image is not associated with the B15-114 source, which is instead located 0.5″ south of it.
Current usage metrics show cumulative count of Article Views (full-text article views including HTML views, PDF and ePub downloads, according to the available data) and Abstracts Views on Vision4Press platform.
Data correspond to usage on the plateform after 2015. The current usage metrics is available 48-96 hours after online publication and is updated daily on week days.
Initial download of the metrics may take a while.