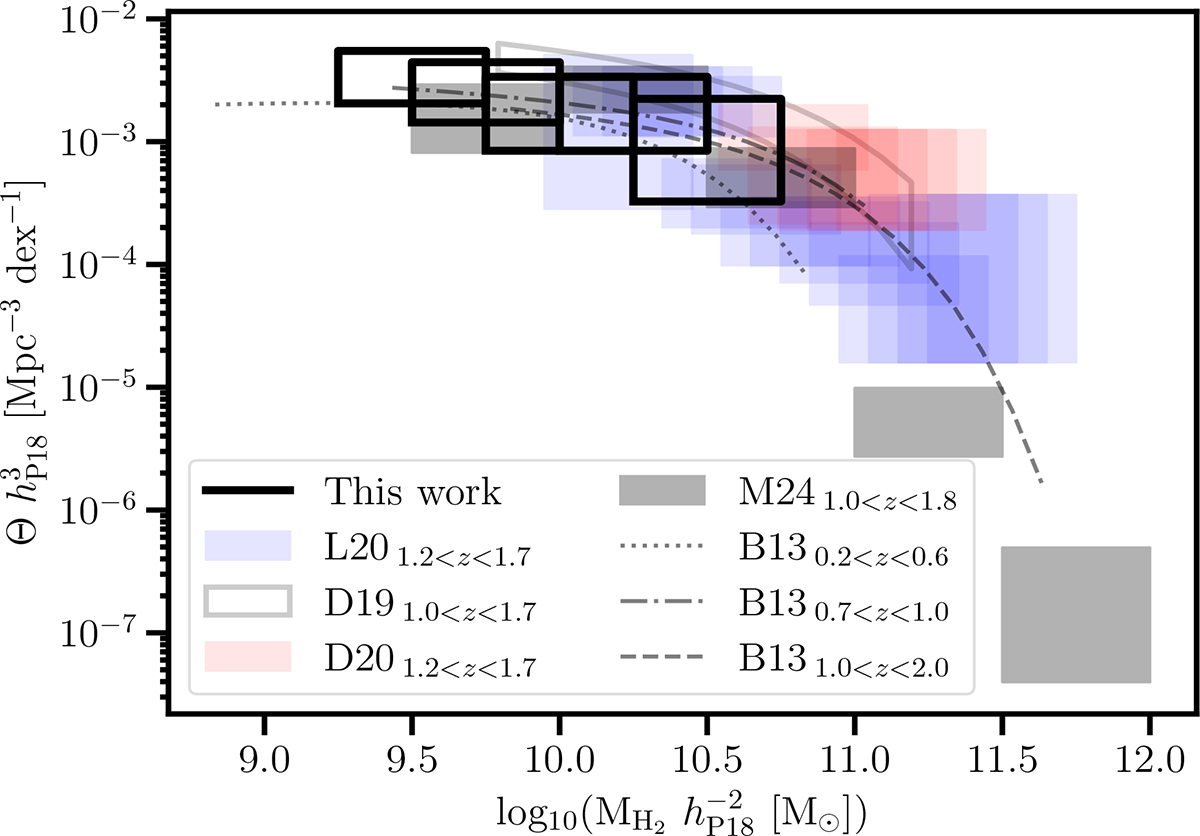
Fig. 11.
Download original image
Molecular gas-mass function derived from the observed group at zspec = 1.284 compared to works in the literature by (Decarli et al. 2019, 2020, D19 and D20, at 1.0 < z < 1.7), (Lenkić et al. 2020, L20, at 1.2 < z < 1.7), and (Messias et al. 2024, M24, at 1.0 < z < 1.8). The results by Berta et al. (2013, different line types for different redshift ranges) were derived from empirical scaling relations, instead of inferring MH2 from CO as the previously cited works. The empty boxes show the results from our study. These are 0.5 dex wide in molecular gas mass (centred at each step of 0.25 dex), and the vertical width shows the statistical uncertainty.
Current usage metrics show cumulative count of Article Views (full-text article views including HTML views, PDF and ePub downloads, according to the available data) and Abstracts Views on Vision4Press platform.
Data correspond to usage on the plateform after 2015. The current usage metrics is available 48-96 hours after online publication and is updated daily on week days.
Initial download of the metrics may take a while.