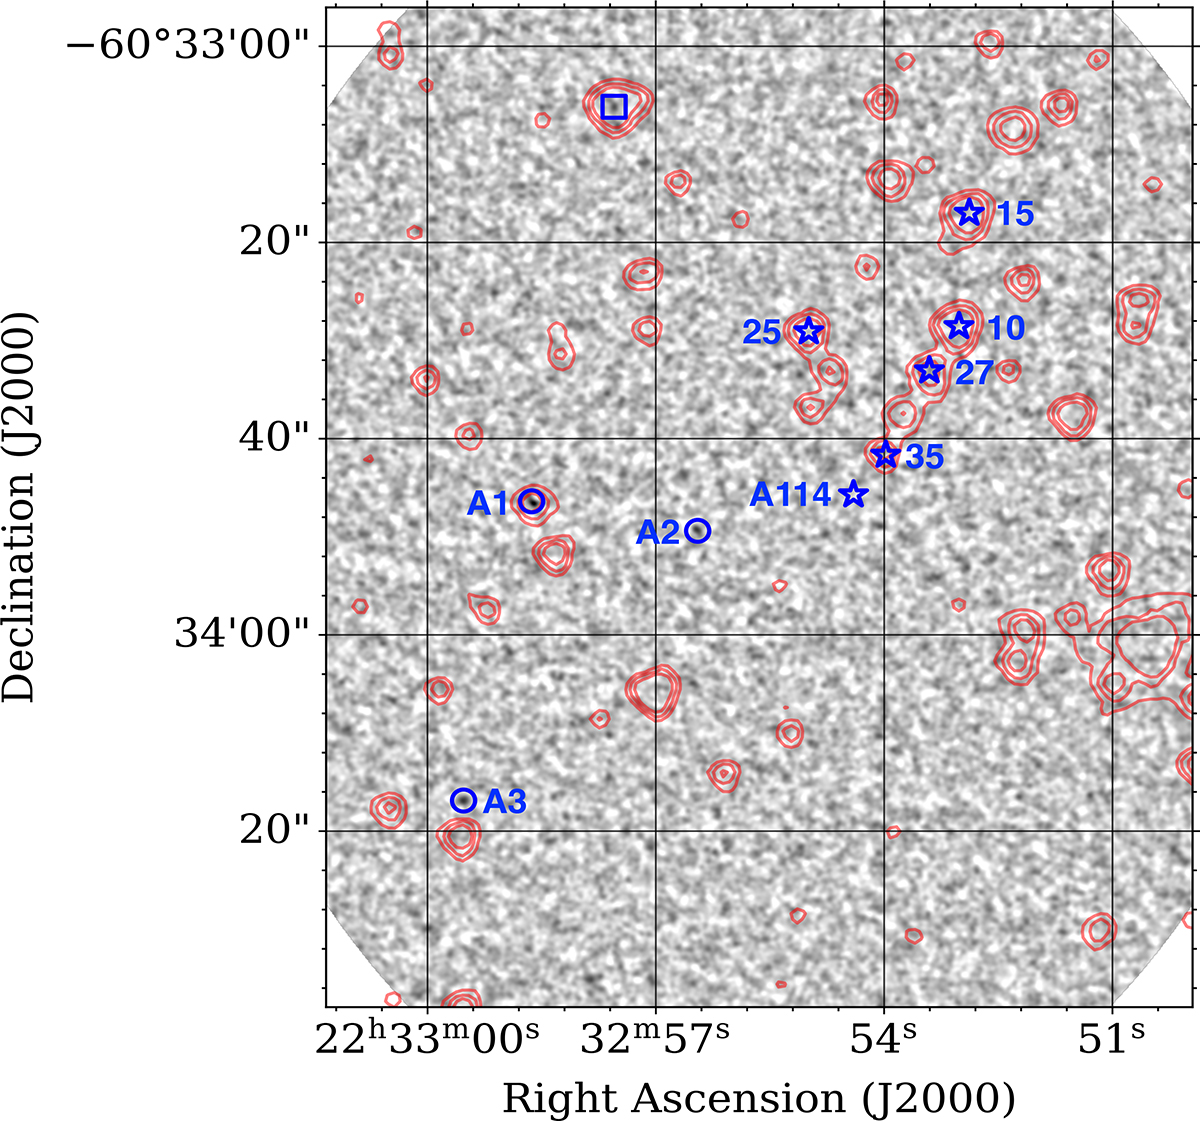
Fig. B.1.
Download original image
The natural-weighted 3mm continuum map with a 0.5” uv-taper (gray scale) with contours overlaid from the IRAC-3.6 μm map (red isocontour levels at 3, 6, and 12σ). Sources that revealed CO (2-1) line emission are marked with open blue stars, while the continuum detections reported in Table 4 are marked as blue circles. The potential 3σ continuum detection toward an IRAC source is marked with a blue square.
Current usage metrics show cumulative count of Article Views (full-text article views including HTML views, PDF and ePub downloads, according to the available data) and Abstracts Views on Vision4Press platform.
Data correspond to usage on the plateform after 2015. The current usage metrics is available 48-96 hours after online publication and is updated daily on week days.
Initial download of the metrics may take a while.