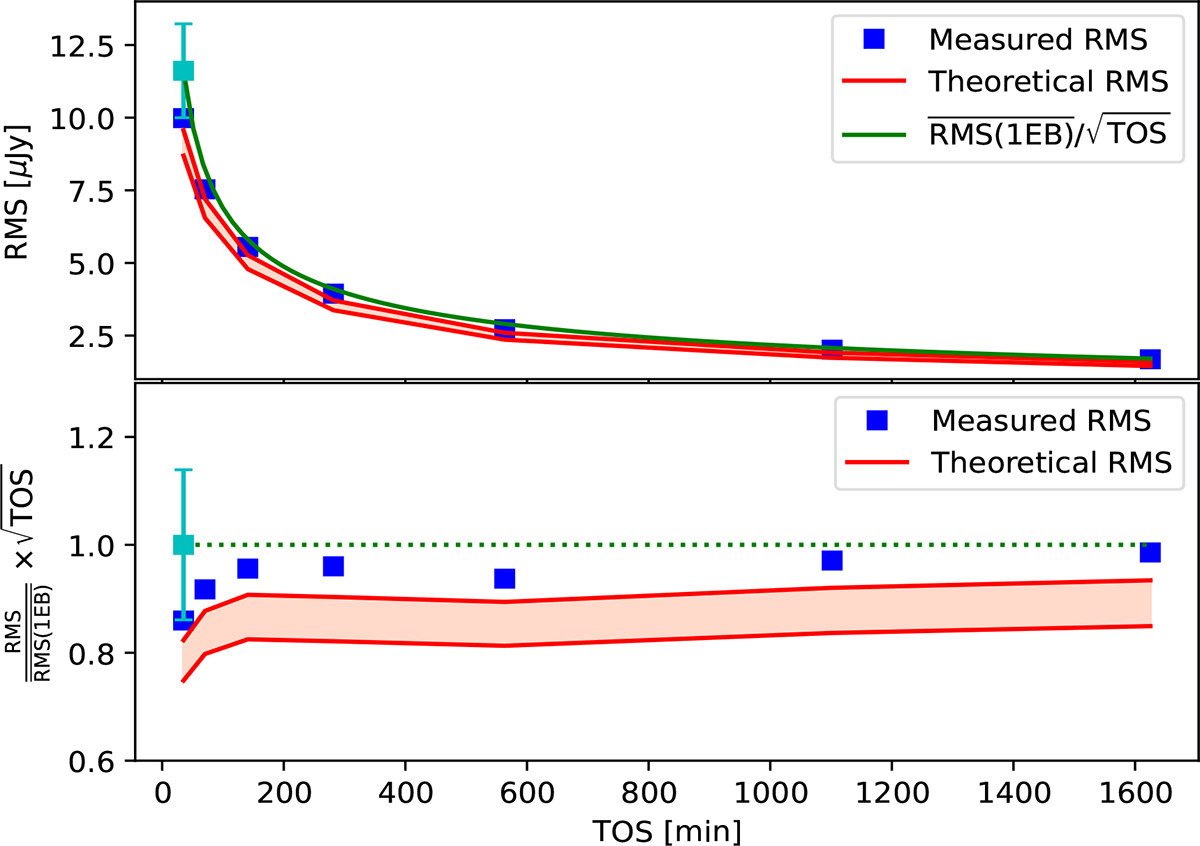
Fig. 3.
Download original image
Sensitivity (noise RMS) as a function of integration time as measured in a sensitivity-ordered sub-sample of 47 EBs with a fixed range of baseline length. The upper plot shows the measured image RMS (blue squares) and the theoretical RMS expected from the radiometric equation and ALMA sensitivity calculator (red shaded region) vs. TOS. The cyan datapoint with the error bar shows the median RMS and the standard deviation of the per-EB continuum map RMS values. The solid green curve shows the expected RMS decrease from this median datapoint with a simple scaling by the square root of the exposure time. The lower plot shows the same information normalised by the solid green curve in the upper plot.
Current usage metrics show cumulative count of Article Views (full-text article views including HTML views, PDF and ePub downloads, according to the available data) and Abstracts Views on Vision4Press platform.
Data correspond to usage on the plateform after 2015. The current usage metrics is available 48-96 hours after online publication and is updated daily on week days.
Initial download of the metrics may take a while.