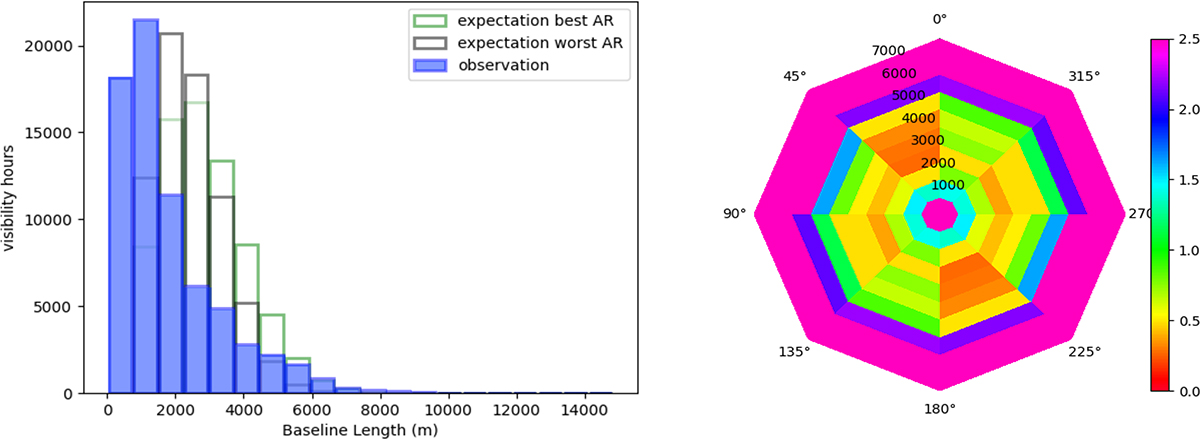
Fig. 4.
Download original image
Assessment of the quality of the uv coverage of our combined data using the tools developed by Petry et al. (2024). (Left) Observed and expected 1D BLDs, i.e. histogram of the baseline lengths of the visibilities for the representative frequency channel (87 GHz) of the dataset (blue) and the corresponding expected histograms for the ideal shape to achieve the most Gaussian PSF given an angular resolution range ±20% around the nominal value of ∼0.13″ (green and grey histograms). (Right) Plot of the ratio of the observed and expected BLD in 2D, i.e., also showing the baseline orientation. A value of 1.0 indicates that observation and expectation agree exactly. Higher values indicate an over-exposure, and lower values show an under-exposure.
Current usage metrics show cumulative count of Article Views (full-text article views including HTML views, PDF and ePub downloads, according to the available data) and Abstracts Views on Vision4Press platform.
Data correspond to usage on the plateform after 2015. The current usage metrics is available 48-96 hours after online publication and is updated daily on week days.
Initial download of the metrics may take a while.