Fig. 5.
Download original image
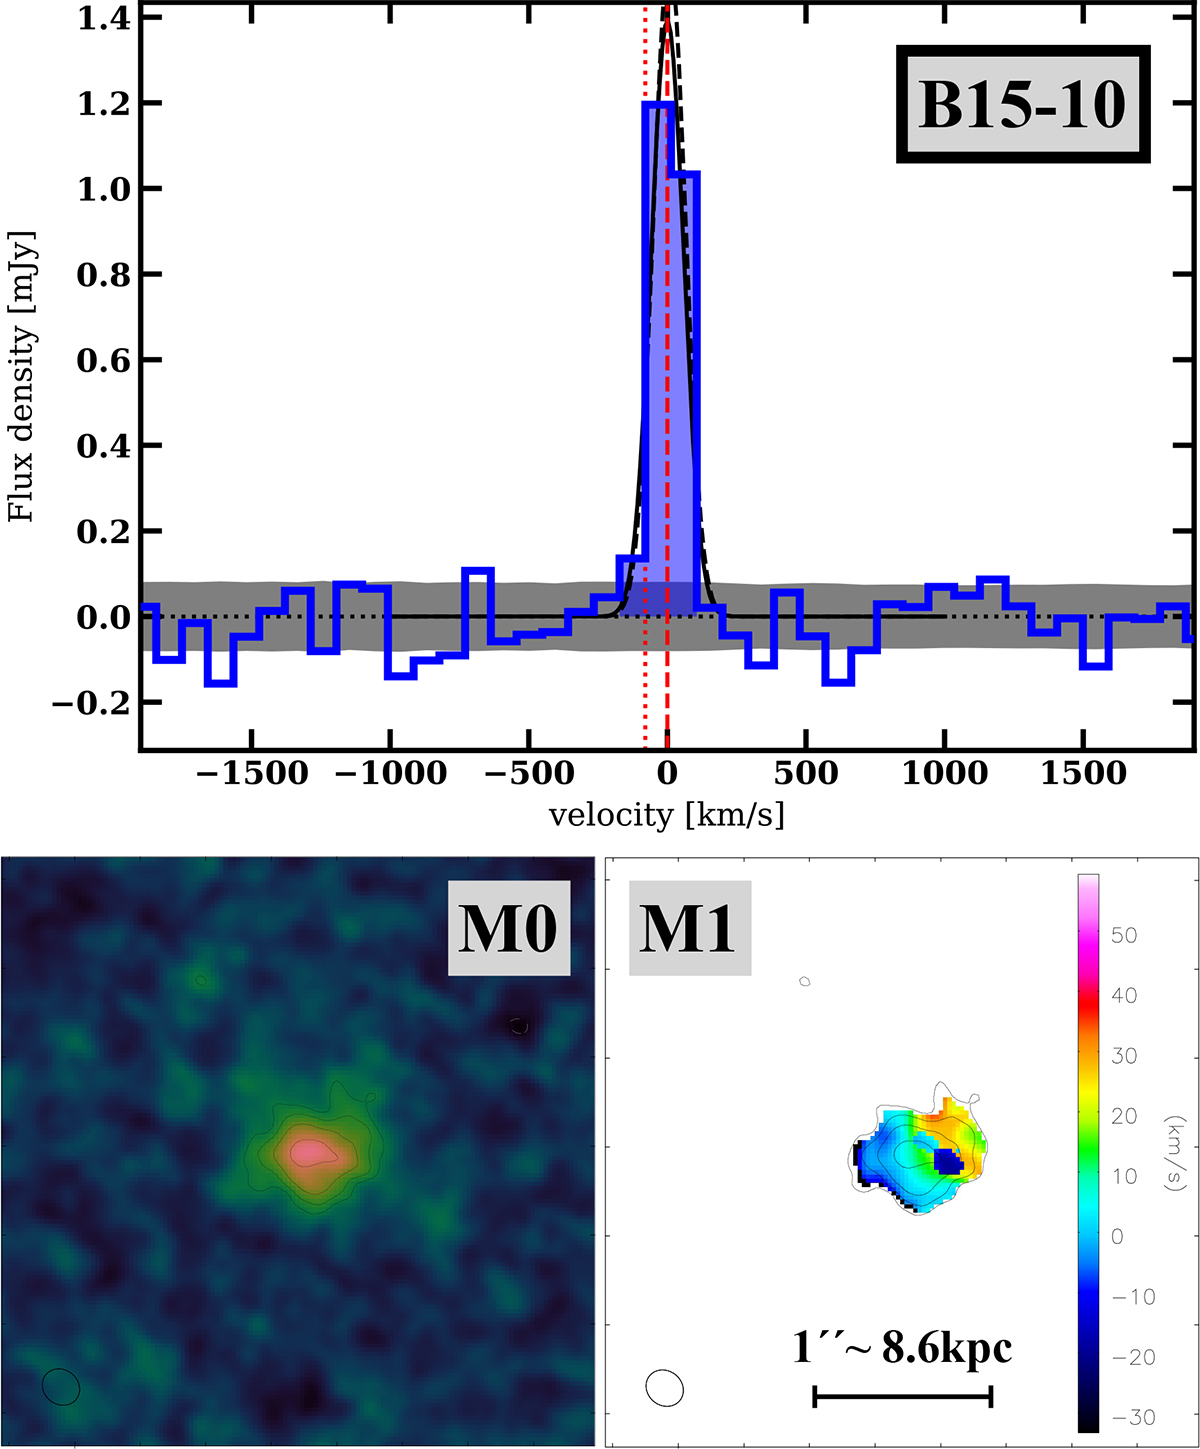
CO (2-1) emission towards B15-10. The cube used for the analysis was imaged with natural weighting and with a smoothing of four channels (i.e. resulting in a spectral resolution of ∼90 km/s). We present the detection spectrum in the top panel, and the velocity-integrated flux map (moment-0, M0) and the velocity map (moment-1, M1) are shown in the bottom left and right panels, respectively. Both maps have the same size (i.e., 3.4″ wide, or ∼29 kpc). The moment-0 contours are overlaid on both maps (solid black contours indicate levels at ![]() RMS, where n = 0, 1, …, and the dashed white contours indicate −3σ). The maps are centred at the position reported by Bacon et al. (2015). The top panel with the spectrum displays a filled spectrum within which the flux was integrated and the moments were obtained. The vertical dashed red line at zero velocity assumes the light-weighted centre frequency, and the dotted vertical red line shows the expected frequency assuming the MUSE-derived redshift. The horizontal shaded grey region shows ±1 times the STD. The thick line shows the single-component Gaussian best fit for the raw spectral resolution (∼24 km/s) cube, and the dashed line shows this for the four-channel-smoothed cube.
RMS, where n = 0, 1, …, and the dashed white contours indicate −3σ). The maps are centred at the position reported by Bacon et al. (2015). The top panel with the spectrum displays a filled spectrum within which the flux was integrated and the moments were obtained. The vertical dashed red line at zero velocity assumes the light-weighted centre frequency, and the dotted vertical red line shows the expected frequency assuming the MUSE-derived redshift. The horizontal shaded grey region shows ±1 times the STD. The thick line shows the single-component Gaussian best fit for the raw spectral resolution (∼24 km/s) cube, and the dashed line shows this for the four-channel-smoothed cube.
Current usage metrics show cumulative count of Article Views (full-text article views including HTML views, PDF and ePub downloads, according to the available data) and Abstracts Views on Vision4Press platform.
Data correspond to usage on the plateform after 2015. The current usage metrics is available 48-96 hours after online publication and is updated daily on week days.
Initial download of the metrics may take a while.