Open Access
Fig. 11
Download original image
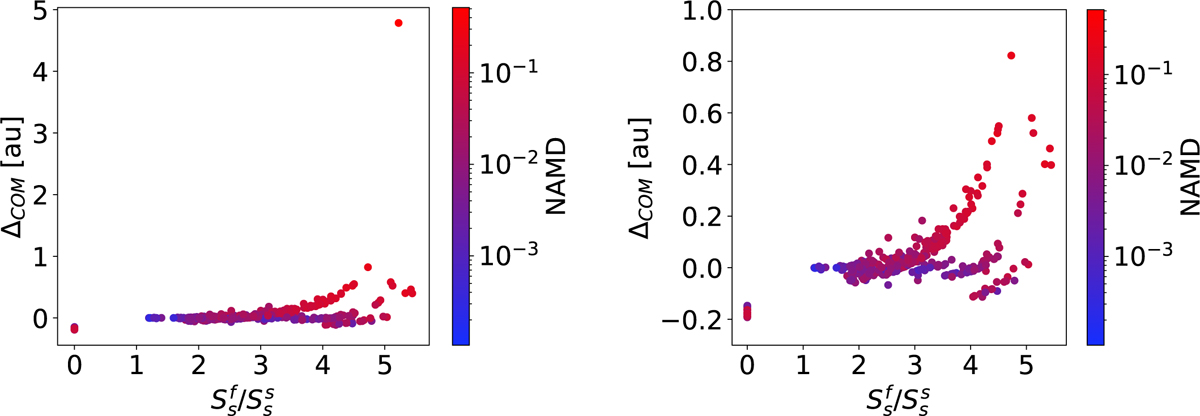
Population D. ∆CoM as a function of ![]() (left panel) with a zoom-in of the region in which ∆CoM < 1 (right panel). Disrupted systems are not displayed in this figure because it was not possible to compute their NAMD and ∆CoM.
(left panel) with a zoom-in of the region in which ∆CoM < 1 (right panel). Disrupted systems are not displayed in this figure because it was not possible to compute their NAMD and ∆CoM.
Current usage metrics show cumulative count of Article Views (full-text article views including HTML views, PDF and ePub downloads, according to the available data) and Abstracts Views on Vision4Press platform.
Data correspond to usage on the plateform after 2015. The current usage metrics is available 48-96 hours after online publication and is updated daily on week days.
Initial download of the metrics may take a while.