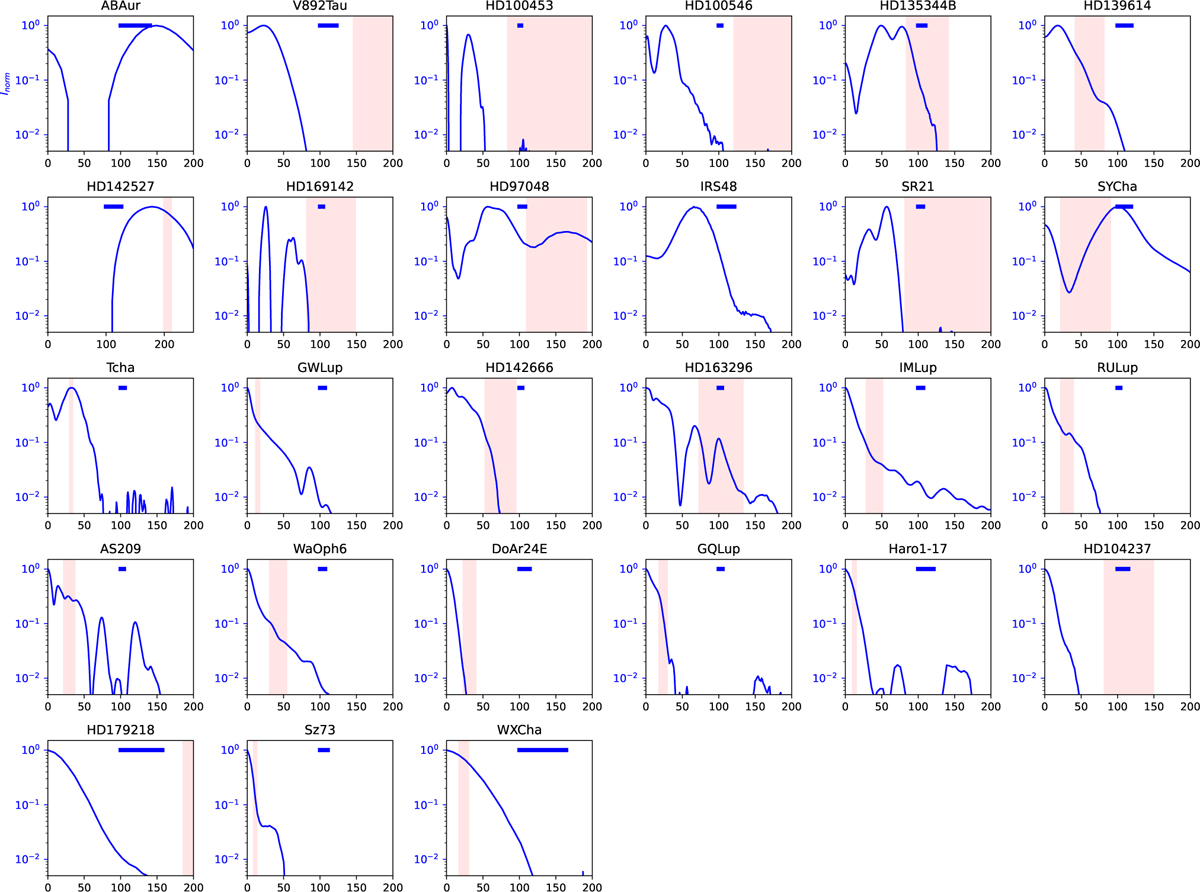
Fig. 2
Download original image
Azimuthally averaged profiles of the ALMA continuum images (see Figure A.1) of the targets in this study. The profiles are normalized to the peak and shown in logarithmic scale. The beam size is indicated with a horizontal blue bar (top right of each profile). The pink shaded region shows the CO snowline in each disk, as defined by the 22-30 K temperature regime, based on the derived temperature profile (see text). For IRS 48, the snowline is beyond the shown radial range. The part of the profile to the left of the pink region is considered the warm dust region, where at least part of the ice is sublimated, potentially releasing PAHs.
Current usage metrics show cumulative count of Article Views (full-text article views including HTML views, PDF and ePub downloads, according to the available data) and Abstracts Views on Vision4Press platform.
Data correspond to usage on the plateform after 2015. The current usage metrics is available 48-96 hours after online publication and is updated daily on week days.
Initial download of the metrics may take a while.