| Issue |
A&A
Volume 706, February 2026
|
|
|---|---|---|
| Article Number | A214 | |
| Number of page(s) | 13 | |
| Section | Interstellar and circumstellar matter | |
| DOI | https://doi.org/10.1051/0004-6361/202453113 | |
| Published online | 16 February 2026 | |
Observational evidence for a possible link between PAH emission and dust trap locations in protoplanetary disks
1
Leiden Observatory, Leiden University,
Leiden,
The Netherlands
2
Faculty of Aerospace Engineering, Delft University of Technology,
Delft,
The Netherlands
3
Center for Space and Habitability, University of Bern,
Gesellschaftsstrasse 6,
3012
Bern,
Switzerland
4
Mullard Space Science Laboratory, University College London,
Dorking,
UK
★ Corresponding author: This email address is being protected from spambots. You need JavaScript enabled to view it.
Received:
21
November
2024
Accepted:
10
November
2025
Abstract
Context. Polycyclic aromatic hydrocarbons (PAHs) are commonly detected in protoplanetary disks, but it is unclear what causes the wide range of intensities across the samples.
Aims. For this work, the measured PAH intensities of a range of disks were compared with ALMA dust continuum images in order to test whether there is evidence that PAHs are frozen out on pebbles in dust traps and only sublimate under certain conditions.
Methods. A sample was constructed from 26 T Tauri and Herbig disks located within 300 pc, with constraints on the 3.3 μm PAH intensity and with high-resolution ALMA continuum data. The midplane temperature was derived using a power law or via radiative transfer modeling. The warm dust mass was computed by integrating the flux within the 30 K radius and converted to a dust mass.
Results. A strong correlation with a Pearson coefficient of 0.88±0.07 between the 3.3 μm PAH intensity and the warm dust mass was found. The correlation is driven by the combination of deep upper limits and strong detections corresponding to a range of warm dust masses. Possible correlations with other disk properties, for example a far-UV radiation field or total dust mass, are much weaker. Correlations with PAH features at 6.2, 8.6, and 11.3 μm are potentially weaker, but this could be explained by the smaller sample for which these data were available.
Conclusions. The correlation is consistent with the hypothesis that PAHs are generally frozen out on pebbles in disks, and are only revealed in the gas phase if those pebbles have drifted toward warm dust traps inside the 30 K radius and vertically transported upward to the disk atmosphere with sufficiently high temperature to sublimate PAHs into the gas phase. This is similar to previous findings on complex organic molecules in protoplanetary disks, and provides further evidence that the chemical composition of the disk is governed by pebble transport.
Key words: astrochemistry / molecular processes / protoplanetary disks / ISM: abundances
© The Authors 2026
 Open Access article, published by EDP Sciences, under the terms of the Creative Commons Attribution License (https://creativecommons.org/licenses/by/4.0), which permits unrestricted use, distribution, and reproduction in any medium, provided the original work is properly cited.
This article is published in open access under the Subscribe to Open model. This email address is being protected from spambots. You need JavaScript enabled to view it. to support open access publication.
1 Introduction
Polycyclic aromatic hydrocarbons (PAHs) are molecules that are constituted of two or more integrated aromatic rings, often set in a honeycomb structure of carbon atoms. They lock up ~20% of all elemental carbon (e.g., Visser et al. 2007) and emit several spectral features through vibrational transitions at infrared wavelengths (Allamandola et al. 1985), for example at 3.3, 6.2, 7.7, 8.6, 11.2, and 12.7 μm. PAHs are strong absorbers in the ultraviolet (UV) and are important contributors to the local gas heating. The different features are attributed to various C-H and C-C bonds as well as ionization (e.g., Acke et al. 2010). PAHs are generally found in high-UV environments and have been observed in a wide variety of sources (the interstellar medium (ISM), dense molecular clouds, circumstellar envelopes and (proto-)planetary nebulae, Peeters et al. 2004). However, the appearance of PAHs in protoplanetary disks, where the building blocks of comets and planets are formed, is not so well understood, in particular the wide variation in PAH spectral intensities in disks. Dozens of protoplanetary disks have been targeted with infrared spectroscopy, for example with ISO, Spitzer, and VLT (Habart et al. 2004a; Geers et al. 2006, 2007b; Acke et al. 2010), and very recently with JWST (e.g., Sturm et al. 2024). These surveys generally show infrared PAH signatures in ~60-70% of the spectra of Herbig stars and only 8% for T Tauri stars. Although a general correlation between PAH detection and stellar temperature linked to the UV radiation field exists, it is not clear why the PAH emission strength or even its detection also varies strongly within spectral type and millimeter-dust disk morphology as traced by ALMA. Specifically, some Herbig disks show relatively strong PAH emission when their disk has a cavity (e.g., HD 100546), whereas others do not (e.g., HD 135344B), while multi-ringed disks without a cavity have much weaker PAH emission (e.g., HD 163296), but compact disks show strong PAH emission (e.g., HD 179218). For T Tauri stars there is a similar range of PAH emission strengths across morphologies (Geers et al. 2007b). These findings hint at a possible link between the millimeter-dust substructures and the PAH intensity.
Several mechanisms have been proposed to explain the diversity of PAH emission in protoplanetary disks. Flared Herbig disks (known as Group I disks) have a higher PAH emission, due to their greater exposure to UV radiation compared to the flat Group II disks, which undergo absorption of PAHs in their inner dusty regions (Meeus et al. 2001; Habart et al. 2004a). The lack of PAH emission in many T Tauri stars may be related to the destruction of PAHs, due to extreme UV and X-ray photons (Siebenmorgen & Krügel 2010) or efficient freeze-out onto dust grains (Geers et al. 2009), followed by ionization reactions that deplete the PAHs (Bouwman et al. 2010). PAHs cluster in outer disk regions where the UV radiation is lower, and therefore PAH dissociation is limited, so that PAH emission at short wavelengths gets suppressed (Rapacioli & Spiegelman 2009; Lange et al. 2021). The last proposed mechanism has led to a more thorough investigation combining cluster formation with freeze-out and vertical mixing (Figure 1 in Lange et al. 2023), showing that clustering followed by freeze-out in the low-UV regime near the midplane of the disk can indeed deplete gasphase PAHs by a factor 50-1000 compared to the ISM. This suggests a scenario where PAHs are locked up in the icy layers on dust grains, unless the dust grains are warm enough to release their icy cover.
In recent years, ALMA observations have demonstrated that a similar mechanism is at play for complex organic molecules (COMs) in disks, in particular in dust traps. Dust traps are recognized as substructures observed in millimeter observations of protoplanetary disks (e.g., Andrews 2020) and are generally interpreted as the result of pressure bumps, which halt millimeter-sized dust grains from drifting inward (Pinilla et al. 2012). In IRS 48, HD 100546, and HD 100453 gas-phase COMs with sublimation temperatures >100 K have been found to be highly abundant and cospatial with these dust traps (e.g., Booth et al. 2021; van der Marel et al. 2021b; Brunken et al. 2022; Booth et al. 2024, 2025). This is interpreted as the release of COMs into the gas-phase due to vertical mixing of the small grains after fragmentation of millimeter-sized pebbles at the location of the dust traps, where the COMs were locked up in icy mantles of the grains and pebbles (see Figure 3 in van der Marel et al. 2021b). Vertical mixing is required as the midplane temperature is generally too low at the dust trap location for sublimation, whereas the higher molecular layers in the disk are significantly warmer (Bruderer et al. 2012). The icy pebbles are transported inward toward the dust trap through radial drift and are inherited from the original molecular cloud. This means that the classical picture of a radial snowline is revised to a snow surface, i.e., a snowline that varies with both temperature and height in the disk (e.g Gavino et al. 2021), where the radius of the midplane CO snowline lies below the H2O (and CH3 OH) snow surface (see Figure 1). It has been proposed that other disks do not show any gas-phase COM emission as their dust traps are located too far out in the disk, i.e., their dust traps are considered cold, whereas IRS 48 and HD 100546 happen to have warm dust traps (van der Marel 2023; Temmink et al. 2023). A similar scenario has been proposed to explain the dichotomy in C/O ratios in disks as measured from C2H emission (van der Marel et al. 2021c). The chemical complexity of irradiated icy dust traps may even lead to the efficient formation of insoluble organic matter (IOM) or macromolecules, a dominant reservoir of organic carbon in meteorites (Alexander et al. 2008; Ligterink et al. 2024).
Spatially resolved PAH emission of a handful of disks using ground-based facilities with a ~0.1-0.2" point spread function (PSF) indicated initially that PAH features were centrally peaked, while long wavelength features were found to be more extended than those at shorter wavelengths (van Boekel et al. 2004; Habart et al. 2004b, 2006; Lagage et al. 2006; Geers et al. 2007a; Boutéraon et al. 2019). However, at least for PAH features at longer wavelengths, the emission has often been shown to be ring-like (Devinat et al. 2022; Yoffe et al. 2023). These spatially resolved features are not obviously linked to the dust substructures, but the interpretation remains limited due to the small sample size. In addition, these surveys have only targeted disks where PAHs were previously detected, so nondetections of PAHs in other disks with similar properties remain unexplained. Therefore, in this study we consider the integrated PAH intensities and their upper limits for a much larger disk sample, and compare their values with the amount of warm dust in these disks.
Within this study, warm dust is defined as the millimeter dust inside the CO snowline, i.e., where CO ice has been sublimated and the midplane temperature is >30 K. Although PAHs sublimate at much higher temperatures (> 150-300 K) (Ligterink & Minissale 2023), such temperatures are easily reached at a few scale heights above the midplane (van der Marel et al. 2021b), so efficient vertical transport of fragmented icy grains to warmer layers where ices could sublimate is required. The definition of the cutoff temperature of the warm dust region is thus chosen at 30 K in the midplane.
For this study we investigated the correlation between warm dust and PAH gas-phase intensity using a sample of suitable pro-toplanetary disks for which PAH intensities are available from the literature, as well as high-resolution ALMA observations and well-defined stellar properties. The paper is structured as follows. In Sect. 2 we present the sample selection criteria and the collection of ALMA data, as well as details on the ALMA observations and temperature profiles. In Sect. 3 we explain the methods that were used to compute the warm dust mass. In Sect. 4 we present the resulting correlations. In Sect. 5 we discuss the implications of our results and draw our conclusions.
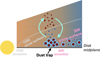 |
Fig. 1 Graphic of the proposed scenario of sublimation in a disk with a warm dust trap, viewed from the side, based on van der Marel et al. (2021b). If the bulk of the dust content is located in a dust trap inside the CO snowline at 30 K, this implies that fragments of its icy pebbles can be transported vertically to the higher disk layers above the H2O snow surface at 150 K, and sublimate their icy content into the gasphase, where it becomes observable. If the bulk of the pebbles is located outside the CO snowline, its icy layers may remain frozen out and its contents are not revealed in the gas phase. Such a scenario may also apply to PAHs, which is the hypothesis of this work. |
2 Data
2.1 Sample
The sample consists of a selection of targets from Habart et al. (2004a) and Geers et al. (2007b), who present ISO spectra of Herbig stars and VLT spectra of T Tauri stars, respectively. These studies report (among others) the integrated intensity of the 3.3 μm PAH feature. From their original target lists, the targets at distances >300 pc were excluded as their dust disks cannot be well constrained due to a lack of spatially well-resolved ALMA data. Targets in the high-extinction CrA region were excluded due to lack of proper stellar information. We also removed close binaries with separation ~0.5-1" (EM SR 9, HT Lup, and SX Cha) as dust disks in such binary systems are truncated and less representative of pure radial drift effects (e.g., Akeson & Jensen 2014). Furthermore, we excluded WL16 as it is an embedded disks and HD 141569 as it is an evolved, debris-like disk. This left 26 targets, which are listed in Table 1.
Sample of disks in this study, based on PAH studies by Habart et al. (2004a) and Geers et al. (2006).
2.2 Stellar properties and PAH intensities
The stellar properties were obtained from the recent literature. Where necessary, values were updated based on the Gaia DR2 distances compared to the original papers.
Polycyclic aromatic hydrocarbon emission consists of multiple infrared features, for example at 3.3, 6.2, 7.7, 8.6, 11.2, and 12.7 μm. The integrated 3.3 μm PAH feature is most commonly reported across a wide range of spectral types, both detections and nondetections (upper limits), and was thus chosen for our main sample analysis. The origin of this feature is likely due to a single aromatic material and its intensity ratio with aliphatic features is independent of the local UV-field, suggesting that these PAHs are continuously replenished at the disk surface (Boutéraon et al. 2019). The measured PAH flux as well as the distance-scaled PAH intensity are listed in Table 1. The intensity was computed by multiplying the flux with 4πd2 × 10−5 with d the distance (in pc). The (scaled) uncertainties are included as well. The upper limits are 5σ, following the convention of the original works.
In addition, we considered the 6.2, 8.6 and 11.3 μm PAH intensities derived by Habart et al. (2004a) and Acke et al. (2010) as these are bright commonly studied features; the 8.6 and 11.3 features were followed up with spatially resolved observations (e.g., Yoffe et al. 2023). Whereas the 3.3 μm feature is dominated by emission from the inner region of the disk, PAH features at longer wavelengths are known to be more extended as they get a larger contribution from the outer disk, due to the lower UV radiation needed to excite these features (Habart et al. 2004a). Furthermore, the 11.3 μm feature is thought to be related to neutral PAHs, whereas the 8.6 μm feature is linked to ionized PAHs, and these features are thus not tightly correlated with each other (e.g Maaskant et al. 2014). Only 12 of our targets (all Herbigs) overlap with the sample from Acke et al. (2010), which means that the analysis of these features is much more limited. This subsample and their scaled PAH intensities are listed in Table 2, where the intensities are scaled to the stellar distance, as explained above.
Subsample of targets with long-wavelength PAH intensities; original data from Acke et al. (2010).
2.3 ALMA data
High-resolution ALMA dust continuum images are available for all targets (for the image gallery, see Figure A.1). The majority of these images have already been published, and we include the published images in this work. For five targets we used the product fits files directly from the ALMA archive as they were sufficient for our purposes. All information on the ALMA images are listed in Table 3. The disks are classified as either a transition disk (TD) with an inner dust cavity, a ring disk (RD) with multiple dust rings (but no inner cavity), or a compact disk (CD) with no evidence of dust rings and with a dust disk radius <20 au, following the classification by van der Marel & Mulders (2021). The ALMA continuum images were used to derive the radial intensity profile of the dust continuum, integrated flux, and dust disk size, as explained in the next section.
The comparison of the ALMA disk morphology with the scaled PAH intensities immediately reveals that the two are not uniquely linked, but that the spectral type plays a role as well: 5 of the 13 transition disks have an upper limit of the 3.3 PAH feature, both for early- and late-type stars; the 7 ring disks have both upper limits and (weak) detections, irrespective of spectral type; and for the compact disks only 1 disk has a strong PAH detection, whereas this is not the only early-type star. Therefore, the combination of disk morphology and spectral type likely plays a role.
3 Analysis
In the first step of the analysis, we checked whether the PAH intensity at 3.3 μm is correlated with the stellar luminosity, far-ultraviolet (FUV) radiation field, or disk dust mass. The FUV radiation field is computed from the stellar spectrum and the accretion rate, using the Kurucz models in combination with a 10 000 K blackbody scaled to the accretion luminosity, following the method by Kama et al. (2016). The FUV luminosity LFUV is computed by integrating the stellar spectrum between 912 and 2050 Å. The FUV radiation field across the disk, named χ, is estimated from LFUV at a distance of 150 au from the star, scaled to the interstellar radiation field ISRF (1.6∙10−6 W m−2 (Habing 1968), following the approach from previous works (Habart et al. 2004a), where a correlation with this parameter is equivalent to a correlation with the FUV luminosity itself. Furthermore, we estimated the FUV radiation field at the inner edge of the disk Rin, which is either the cavity radius for the transition disks or the dust sublimation radius (defined as Rsub ≈ 0.07(L*/L⊙)1/2, assuming Tsub = 1500 K, Dullemond et al. 2001) for other disks, as well as the radiation field at the outer edge of the dust disk, taken as the size of the dust disk Rsize.
The dust disk size Rsize is derived from the ALMA images (Figure A.1) using a curve-of-growth method, encircling 90% of the total flux, following previous works (Tripathi et al. 2017). The compact disks are only marginally resolved, so for those disks we used the CASA imfit task to estimate the FWHM to measure the radius of each dust disk. For the majority of targets Rsize is measured at ~1 mm wavelength (ALMA Band 6 or 7); for HD 135344B, T Cha, and HD 179218 longer wavelength images were used, which means that their disk sizes could be somewhat larger at 1 mm. These radii are listed in Table 3.
Finally, we estimate the total dust mass using the common equation related to the total millimeter flux Fν for an assumed temperature of 20 K and optically thin emission as (Hildebrand 1983)
 (1)
(1)
with distance d, Planck function Bν, dust opacity κν (where κ1000GHz = 10 g cm−2 and κν ∝ νβ with β=1). The uncertainty on this parameter is 10%, following the flux calibration uncertainty of ALMA. Furthermore, the assumption of optically thin emission may not be fully valid in protoplanetary disks, and the dust mass values are technically lower limits to the pebble mass (Zhu et al. 2019). However, as all disks are computed in the same way, the assumption is sufficient for the comparison in this work.
Second, we estimate the warm dust mass in each disk using the spatially resolved ALMA emission inside the 30 K radius, where at least the CO ice is fully sublimated in the midplane, in a similar way to van der Marel et al. (2021c). The midplane temperature profile of each disk is estimated using a power-law profile assuming a passively heated disk, following Chiang & Goldreich (1997):
 (2)
(2)
Here L* is the stellar luminosity, the flaring angle φ=0.02, σSB is the Stefan-Boltzmann constant, and the radius is r. Transition disks generally have a different temperature profile, due to their empty cavity and heated cavity edge, and their temperature profiles are estimated individually using a RADMC-3D model fitting the spectral energy distribution (SED; see Appendix B).
Using these temperature profiles, we derived the radius of the CO snowline in each disk, for which different values have been found, ranging between 18 and 35 K (e.g., Bisschop et al. 2006; Pinte et al. 2018; Qi et al. 2019; Minissale et al. 2022; Guilloteau et al. 2025). The warm dust mass flux was computed for each disk by integrating the millimeter flux from 0 out to the radius where the midplane temperature drops below 30 K, which is spatially resolved in all cases except WX Cha and Sz73. Figure 2 shows the radial intensity profiles of each ALMA millimeter image with the 22-30 K regime and spatial resolution indicated. Whereas the exact cutoff temperature has an impact on the warm dust mass, this range shows that the impact is generally negligible. Using this flux and Equation (1) for T=30 K, we compute the warm dust mass, which is listed in Table 3. Although the temperature increases to ≫30 K within the warm dust region, the dust mass is dominated by the temperature at the outer radius, due to the shape of the temperature profile, and thus 30 K is a reasonable choice. The uncertainty on the warm dust mass is again 10%, following the flux calibration uncertainty of ALMA. For WX Cha and Sz73, the spatial resolution is insufficient to resolve the emission around the CO snowline and we used an upper limit to the total dust mass as the value.
In 10 out of 26 targets, the millimeter emission is entirely inside the 30 K radius, and the integrated flux for the warm dust mass is equal to the total flux. In that case, the difference between total and warm dust mass is caused by the assumption of the temperature in Bν(T) in Eq. (1), and changes by a factor 1.7. For all other disks, the warm dust mass is (much) lower than the total dust mass, up to a factor 18.
Properties ALMA continuum data used in this study.
4 Results
Figure 3 shows the 3.3 μm PAH intensity as a function of various radiation properties as well as the total dust mass. Using the linmix package (Kelly 2007), we performed a linear fit to the logarithmic data including the upper limits. We scaled the 5σ limits on the PAH intensity to 3σ limits for consistency with the linmix methodology in these plots and calculations. We find Pearson correlation coefficients as reported in the lower left corner of each plot: R = 0.80 ± 0.10, −0.15 ± 0.19,0.52 ± 0.18, and 0.59±0.17 for correlations with the FUV radiation field χ, FUV at the inner disk edge, FUV at the outer disk edge, and total dust mass, respectively. We also computed the Pearson correlation coefficients of the fit of the data of the detected PAH intensities only (excluding the upper limits from the fit), which generally results in somewhat lower correlation coefficients with larger error bars: R = 0.63 ± 0.23, −0.23 ± 0.30,0.41 ± 0.30, and 0.54 ± 0.26.
These results imply that a correlation exists for χ, and that there is a tentative correlation for the total dust mass and an even more moderate correlation for the FUV at the outer disk edge. This is consistent with earlier suggestions by models that the PAH intensity may scale with the radiation field (Habart et al. 2004a). All plots show large scatter, in particular when considering the upper limits. The correlation is not unambiguous and does not explain why disks with similar spectral types or similar disk morphologies show such a wide spread in PAH intensity.
Second, Figure 4 shows the 3.3 μm PAH intensity as a function of the warm dust mass, computed from the flux inside the 30 K radius. For some disks the warm dust mass is an upper limit as the continuum emission was insufficiently resolved with respect to the CO snowline (see Figure 2). The data points show clear evidence of a correlation between the two parameters. Analysis with linmix including the PAH intensity upper limits results in a Pearson correlation coefficient of r = 0.88 ± 0.07, consistent with a very strong correlation. When considering only the data points of detected PAH 3.3 μm intensities, the Pearson correlation coefficient is R = 0.71 ± 0.21, showing that the upper limits are important drivers of the correlation.
The three groups of disks (transition, compact, and ring disks) are color-coded to check for trends. Transition disks are found across the range of PAH intensity, consistent with a variation of warm and cold dust traps (van der Marel 2023) and some of the strongest PAH intensities are found in transition disks. On the other hand, if the dust trap is cold (outside the 30 K radius) such as SY Cha and T Cha, the PAH intensity is much lower.
Although compact disks are warm, their dust mass tends to be lower in most cases due to their smaller size, and thus millimeter flux. An obvious outlier is HD 179218 with a very strong PAH flux for its warm dust mass. Half of the ring disks show a moderate PAH intensity. Whereas ring disks have total dust masses similar to those of transition disks, the bulk of their dust mass is relatively cold. One outlier here is HD 163296, with a rather low PAH intensity limit compared to its warm dust mass.
Finally, we considered the correlation between the warm dust mass and three other PAH features at 6.2, 8.6, and 11.3 μm for a subsample of our targets. The relation between these parameters is shown in Figure 5. The correlation coefficient is again computed using linmix (including upper limits), resulting in Pearson coefficients of typically 0.5±0.3 (see figure), i.e., moderately positive correlations, although within the uncertainties still matching with the 3.3 um correlation in a much larger sample. However, if we compute the correlation coefficient for the 3.3 μm feature for this subsample only, the Pearson correlation coefficient is R = 0.42 ± 0.32, i.e., the correlation disappears. This implies that there is some intrinsic scatter in the PAH intensities when using a smaller subsample.
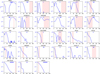 |
Fig. 2 Azimuthally averaged profiles of the ALMA continuum images (see Figure A.1) of the targets in this study. The profiles are normalized to the peak and shown in logarithmic scale. The beam size is indicated with a horizontal blue bar (top right of each profile). The pink shaded region shows the CO snowline in each disk, as defined by the 22-30 K temperature regime, based on the derived temperature profile (see text). For IRS 48, the snowline is beyond the shown radial range. The part of the profile to the left of the pink region is considered the warm dust region, where at least part of the ice is sublimated, potentially releasing PAHs. |
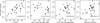 |
Fig. 3 3.3 μm PAH intensity as a function of various stellar and disk parameters. From left to right are shown the parameter χ (FUV radiation field at 150 au from the star) and the FUV radiation field at the inner disk edge Rin and at the disk outer edge Rsize. The rightmost panel shows the 3.3 μm PAH intensity as a function of the total disk dust mass. Upper limits are indicated as empty circles with arrows. The Pearson correlation coefficient is indicated in the lower left corner of each panel. |
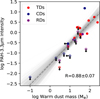 |
Fig. 4 3.3 μm PAH intensity as a function of the warm dust mass, computed from the millimeter flux inside the 30 K radius (CO snowline). The different colors represent the transition disks (TDs, red), compact disks (CDs, blue), and ring disks (RDs, purple). Upper limits are indicated as empty circles with arrows. The dashed line shows the best linear fit for the data points with the gray lines showing the spread between the fits. The fit has a Pearson coefficient of r = 0.88 ± 0.07 and the data are strongly correlated. |
5 Discussion
5.1 Origin of PAH emission in protoplanetary disks
The strong correlation between the warm dust mass and the 3.3 μm PAH intensity regardless of disk morphology provides evidence for a scenario where PAHs are sublimated from icy dust pebbles transported vertically upward, after those pebbles have drifted inward toward the pressure bump(s) in the disks. This is comparable to the findings of van der Marel et al. (2021b) and Booth et al. (2021), among others, on the release of CH3OH ice into the gas-phase in IRS 48 and HD 100546 from the main dust traps in those disks. Fragmentation and vertical transport through turbulence is required, as PAHs sublimate at high temperatures, > 150-300 K, compared to the midplane temperature, which are only reached at higher scale heights at the dust locations (Bruderer et al. 2012; van der Marel et al. 2021b). This is consistent with the predictions from PAH disk models from Lange et al. (2023) who have calculated in which layers of the disk PAHs are dissociated and form clusters. Our proposed scenario is similar to this idea, with the additional insight that locked up PAHs are transported with the pebbles toward their final location in the disk, where they only desorb if the local temperature is above the PAH sublimation temperature. If the majority of PAHs remain locked up in cold dust traps (e.g., as seen in SY Cha and in the ring disks), the observed PAH intensity from gas-phase PAHs remains low. In this way, PAH intensities can be explained for the range of T Tauri and Herbig stars as well as their individual dust substructures.
On the other hand, for PAH features at longer wavelengths these correlations are potentially weaker (Figure 5). This correlation only covers a small part of the sample though, including only Herbig disks. This results in larger uncertainties on the correlation coefficient, and a lack of disks where the bulk of the dust mass is cold (i.e., outside the CO snowline). The correlation coefficient of the 3.3 μm feature is indeed much lower as well if only this subsample is considered. Furthermore, Geers et al. (2007b) reports the nondetection of the 8.6 μm PAH feature in T Cha, SY Cha, and WX Cha, with very weak detections and nondetections of the 11.3 μm PAH feature, which are all T Tauri disks with small warm dust masses. As quantitative information is missing, these targets could not be added to our plot, but such data certainly strengthens the correlation. The observed trend at the long wavelength PAH features thus does not contradict the findings for the 3.3 μm feature and is consistent with the main hypothesis. It is also possible that the PAH intensity is not a sufficiently direct tracer of the amount of released PAHs, and thus, of
the amount of warm dust pebbles, and therefore the correlation is not reflected by the properties of the detected targets alone. The correlation is driven by the combination of deep upper limits and strong detections corresponding to a range of warm dust masses.
If PAHs are indeed locked up in ices in protoplanetary disks and only revealed in infrared observations due to sublimation, this implies that significantly large amounts of PAHs are present in planet forming regions, but mostly in solid form. This is particularly interesting in high-UV regions, as irradiated ices have been shown to rapidly form organic macromolecules (Ligterink et al. 2024). The destruction of PAHs through UV radiation into smaller components may result in a more efficient formation process of such macromolecules (Alexander et al. 2008). On the other hand, there is also the possibility that (frozen) PAHs in disks are not inherited from the ISM, but form in situ under the influence of radiation. However, the omnipresence of PAHs in the ISM makes this unnecessary, and a thorough investigation of the fractional abundances of PAHs in disks compared to ISM would be required to test this.
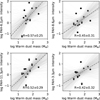 |
Fig. 5 PAH intensity as a function of warm dust mass for the long wavelength features at 6.2, 8.6, and 11.3 μm, as well as the 3.3 μm for the subsample for which the other PAH features were available (Table 2). |
5.2 Outliers in the warm dust-PAH intensity correlation
The two exceptions in the main correlation with the 3.3 μm feature in Figure 4 are HD 179218 and HD 163296. HD 179218 has a very high PAH intensity for its warm dust mass, also seen in the correlations with the 6.2 and 8.6 μm features. However, since this is a compact disk, it is plausible that the warm dust mass is underestimated by a factor of a few due to optically thick emission, as Eq. (1) is only valid for optically thin emission. This would bring this data point in line with the observed trend. Second, HD 163296 appears to lie below the trend with an upper limit on the 3.3 μm PAH intensity and a fairly high warm dust mass. However, inspection of its radial profile in Figure 2 shows that there is a rather wide dust gap outside the CO snowline and it is possible that the majority of icy dust pebbles is halted outside, lowering the amount that ends up in the warm region. This would decrease the amount of sublimating icy pebbles in this disk and also move this data point closer to the general trend. This is a complex problem as it depends on which dust traps form first in the disk (Pinilla et al. 2015). However, quantifying the amount of icy pebbles that make it through the gap is beyond the scope of this work. Removing HD 179218 and HD 163296 from the sample of Figure 4 increases the Pearson correlation coefficient to R = 0.94 ± 0.04. Potential other outliers in the long wavelength PAH features in Figure 5 are HD 104237 and HD 139614, for which the PAH upper limits appear to be very low compared to the main trend.
In the sample selection, a number of targets from the original samples of Habart et al. (2004a) and Geers et al. (2007b) were excluded to ensure that the analysis would be consistent. For the majority of those targets only upper limits on the PAH 3.3 μm were reported. A remarkably bright PAH source is HD 98922, a massive A0 Herbig star at 650 pc of 5.5 M⊙ and 1200 L⊙ with a flat SED and faint polarized emission (Garufi et al. 2022). As these authors report, only low-resolution ALMA data exist (2015.1.01600.S) and the disk is detected but unresolved. If this system follows the trend from Figure 4, the warm dust mass is expected to be very high. Determining the warm dust mass would require higher resolution data and a full modeling of the temperature structure, which is left for future work.
5.3 Spatially resolved PAH emission
From the integrated fluxes studied in this work it remains unclear if the PAH emission indeed originates from the dust trap region. For a subset of seven targets in our sample (AB Aur, HD 100453, HD 100546, HD 169142, HD 97048, IRS 48, and HD 163206, mostly transition disks), spatially resolved information of the PAH features is available in the literature. The spatial extent of the 3.3 μm feature has been estimated for HD 97048, IRS 48, HD 100453, HD 100546, and HD 169142 using VLT/NACO data (Habart et al. 2006; Geers et al. 2007b; Boutéraon et al. 2019). These profiles are somewhat broader than the PSF of ~0.1-0.2" so although it is not possible to radially resolve a profile or constrain the inner edge, the spatial extent could be determined, which ranges up to radii of 0.9". For the 8.6 and 11.3 μm feature, the spatially resolved intensity profiles have been obtained with the VISIR-NEAR instrument for ABAur, HD 100546, HD 97048, HD 169142, and HD 163296 (Yoffe et al. 2023). For IRS 48, the spatial extent of these features is constrained with VISIR where the inner edge remains unconstrained (Geers et al. 2007a).
Figure 6 shows the spatial extent of the 3.3, 8.6, and 11.3 μm features from the literature described above. The 3.3 μm feature is indicated as a horizontal bar, where the inner part shows a dotted profile of the PSF size to indicate the inner edge is unconstrained. Since the 3.3 μm feature is only marginally resolved, its emission may be ring-like as well. The other two features are taken directly from (Yoffe et al. 2023), where available. For HD 169142, the 11.3 μm emission is consistent with a ring of 0.14-0.17" radius (Devinat et al. 2022; Yoffe et al. 2023), so this is also overlaid. These PAH extents are compared in Figure 6 with the 13CO 3-2 or 2-1 radial profiles taken from Wölfer et al. (2023) and the ALMA continuum as derived in Figure 2. For HD 100453 only 12CO 3-2 data were available. The spatially resolved 13CO 3-2 or 2-1 line provides a proxy of the gas gap inside the dust cavity (van der Marel et al. 2016; Facchini et al. 2018), although the gap depth could be overestimated if the gas is too warm to excite these transitions (Leemker et al. 2022). The 12CO line of HD 100453 becomes optically thin as well in the very inner part of the cavity, revealing the deepest part of the gas gap.
For AB Aur, HD 100546, HD 169142, HD 97048, IRS 48, and potentially HD 100453, the PAH emission peaks inside the cavity. For HD 169142 and HD 100546 the spatially resolved PAH ring is close to the inner edge of the dust ring; for AB Aur the PAH ring is well inside. For HD 163296 the PAH ring appears to coincide with the third dust ring. Therefore, the spatial information also shows that PAH emission is possibly correlated with the dust trap, hinting that they could be PAHs sublimating from vertically stirred grains. The emission does not fully correspond to the location of the dust ring or dust crescent itself, for example the CH3OH emission in IRS 48 (van der Marel et al. 2021b). However, since gas extends within the cavity, as seen in the 13CO emission, and from the high accretion rates of each of these disks (Table 1), the sublimated PAHs may follow the accretion flow through the gap without being destroyed, and may emit primarily in the inner region with the highest UV radiation. In contrast, the reason that the CH3OH emission in IRS 48 has the same morphology as the dust crescent is that the gas molecules are rapidly photodissociated outside the dust trap, and continuously replenished at the dust trap through sublimation (Temmink et al. 2025). Furthermore, the PAH emission sometimes also extends out to larger radii. Additional radial transport, such as turbulent mixing and diffusion likely play a role here, and sublimation is not the sole process setting the radial extent of the PAH emission. Further studies including sublimation and transport processes are required to fully quantify this.
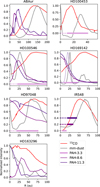 |
Fig. 6 Radial profiles of the 13CO 3-2 or 2-1 line (red) and ALMA continuum (gray), in combination with the maximum spatial extent of the PAH 3.3 μm emission (plum bar), and the derived spatial profiles of the PAH 8.6 (purple) and PAH 11.3 (indigo) features when available. The spatial extent is not constrained for the inner edge of the disk, so the inner region (PSF radius) is indicated as dotted rather than solid in the horizontal bar. For IRS 48, the spatial extent is only available for the 8.6 and 11.3 features. For HD 169142, the 11.3 emission is consistent with a ring (Devinat et al. 2022; Yoffe et al. 2023), which is overplotted as a dotted line. The 13CO curves are from Wölfer et al. (2023) and Zhang et al. (2021); the continuum curves are from this work. For HD 100453 12CO 3-2 is plotted instead of 13CO 3-2, as they are the only available line data for this source. The spatial extent of the PAH emission is generally just inside the dust cavity. |
6 Conclusions
In this study, we analyzed the PAH intensity of the 3.3 μm feature for a large sample of T Tauri and Herbig disks from the literature, as well as the 6.2, 8.6, and 11.3 μm PAH features for a subset of Herbig disks, to test for correlations with disk and radiation properties. We conclude the following:
A strong correlation with a Pearson coefficient of 0.88±0.08 was found between the 3.3 μm PAH intensity and the warm dust mass, which is defined as the millimeter dust mass measured from ALMA continuum observations within the 30 K midplane radius.
The 3.3 μm PAH intensity has (much) weaker correlations with other relevant parameters such as the FUV luminosity, the FUV radiation field at the inner and outer edges of the disk, and the total dust mass;
The 6.2, 8.6, and 11.3 μm features show somewhat weaker correlations with warm dust mass for a smaller subsample, but within the uncertainties matching the correlation of the 3.3 μm feature;
The spatial distribution of the PAH features (where available) is generally inside of the dust trap locations, suggesting that gas-phase PAHs may follow the accretion flow after sublimation without being destroyed, although additional transport such as diffusion and turbulent mixing may also play a role;
The correlation with warm dust mass is consistent with the hypothesis that PAHs are generally frozen out in protoplan-etary disks, and only become detectable in the gas-phase when icy pebbles drift inward, get transported vertically upward and sublimate their icy layers, similar to previous findings for complex organic molecules (COMs) in dust traps (van der Marel et al. 2021b; Booth et al. 2021). This can explain the PAH intensity with respect to the range in dust disk morphologies and stellar luminosities in the sample;
The findings regarding PAH sublimation provide further evidence that disk composition is governed by icy pebble transport, rather than static chemical equilibrium.
Acknowledgements
We thank the referee for their thorough report and useful suggestions. We would also like to thank Margot Leemker, Kevin Lange, Rens Waters, Ella de Vries and Judith Moulijn for useful discussions. M.T. acknowledges support from the ERC grant 101019751 MOLDISK. This paper makes use of the following ALMA data: ADS/JAO.ALMA#2012.1.00631.S, 2013.1.00100.S, 2013.1.00157.S, 2013.1.00498.S, 2015.1.00773.S, 2015.1.00979.S, 2016.1.00336.S, 2016.1.00340.S, 2016.1.00344.S, 2016.1.00484.L, 2016.1.00826.S, 2017.1.01424.S, 2018.1.00689.S, 2018.1.01458.S, 2021.1.00709.S, 2021.1.00854.S, 2021.1.01137.S, 2022.1.01302.S. ALMA is a partnership of ESO (representing its member states), NSF (USA) and NINS (Japan), together with NRC (Canada), NSTC and ASIAA (Taiwan), and KASI (Republic of Korea), in cooperation with the Republic of Chile. The Joint ALMA Observatory is operated by ESO, AUI/NRAO and NAOJ.
References
- Acke, B., Bouwman, J., Juhász, A., et al. 2010, ApJ, 718, 558 [Google Scholar]
- Akeson, R. L., & Jensen, E. L. N. 2014, ApJ, 784, 62 [Google Scholar]
- Alexander, C. M. O., Cody, G. D., Fogel, M., & Yabuta, H. 2008, in IAU Symposium, Organic Matter in Space, eds. S. Kwok, & S. Sanford, 251, 293 [Google Scholar]
- Allamandola, L. J., Tielens, A. G. G. M., & Barker, J. R. 1985, ApJ, 290, L25 [Google Scholar]
- Andrews, S. M. 2020, ARA&A, 58, 483 [Google Scholar]
- Andrews, S. M., Huang, J., Pérez, L. M., et al. 2018, ApJ, 869, L41 [NASA ADS] [CrossRef] [Google Scholar]
- Ansdell, M., Gaidos, E., Hedges, C., et al. 2020, MNRAS, 492, 572 [Google Scholar]
- Bisschop, S. E., Fraser, H. J., Öberg, K. I., van Dishoeck, E. F., & Schlemmer, S. 2006, A&A, 449, 1297 [NASA ADS] [CrossRef] [EDP Sciences] [Google Scholar]
- Booth, A. S., Walsh, C., Terwisscha van Scheltinga, J., et al. 2021, Nat. Astron., 5, 684 [NASA ADS] [CrossRef] [Google Scholar]
- Booth, A. S., Leemker, M., van Dishoeck, E. F., et al. 2024, AJ, 167, 164 [NASA ADS] [CrossRef] [Google Scholar]
- Booth, A. S., Wölfer, L., Temmink, M., et al. 2025, ApJ, 986, L9 [Google Scholar]
- Bosschaart, Q., Guerra-Alvarado, O., van der Marel, N., & Mulders, G. 2025, A&A, submitted [Google Scholar]
- Boutéraon, T., Habart, E., Ysard, N., et al. 2019, A&A, 623, A135 [NASA ADS] [CrossRef] [EDP Sciences] [Google Scholar]
- Bouwman, J., Cuppen, H. M., Bakker, A., Allamandola, L. J., & Linnartz, H. 2010, A&A, 511, A33 [NASA ADS] [CrossRef] [EDP Sciences] [Google Scholar]
- Bruderer, S., van Dishoeck, E. F., Doty, S. D., & Herczeg, G. J. 2012, A&A, 541, A91 [NASA ADS] [CrossRef] [EDP Sciences] [Google Scholar]
- Brunken, N. G. C., Booth, A. S., Leemker, M., et al. 2022, A&A, 659, A29 [NASA ADS] [CrossRef] [EDP Sciences] [Google Scholar]
- Cazzoletti, P., van Dishoeck, E. F., Pinilla, P., et al. 2018, A&A, 619, A161 [NASA ADS] [CrossRef] [EDP Sciences] [Google Scholar]
- Chiang, E. I., & Goldreich, P. 1997, ApJ, 490, 368 [Google Scholar]
- Cox, E. G., Harris, R. J., Looney, L. W., et al. 2017, ApJ, 851, 83 [Google Scholar]
- Devinat, M., Habart, É., Pantin, É., et al. 2022, A&A, 663, A151 [NASA ADS] [CrossRef] [EDP Sciences] [Google Scholar]
- Dullemond, C. P., Dominik, C., & Natta, A. 2001, ApJ, 560, 957 [NASA ADS] [CrossRef] [Google Scholar]
- Facchini, S., Pinilla, P., van Dishoeck, E. F., & de Juan Ovelar, M. 2018, A&A, 612, A104 [NASA ADS] [CrossRef] [EDP Sciences] [Google Scholar]
- Francis, L., & van der Marel, N. 2020, ApJ, 892, 111 [Google Scholar]
- Garufi, A., Dominik, C., Ginski, C., et al. 2022, A&A, 658, A137 [NASA ADS] [CrossRef] [EDP Sciences] [Google Scholar]
- Gavino, S., Dutrey, A., Wakelam, V., et al. 2021, A&A, 654, A65 [NASA ADS] [CrossRef] [EDP Sciences] [Google Scholar]
- Geers, V. C., Augereau, J.-C., Pontoppidan, K. M., et al. 2006, A&A, 459, 545 [NASA ADS] [CrossRef] [EDP Sciences] [Google Scholar]
- Geers, V. C., Pontoppidan, K. M., van Dishoeck, E. F., et al. 2007a, A&A, 469, L35 [NASA ADS] [CrossRef] [EDP Sciences] [Google Scholar]
- Geers, V. C., van Dishoeck, E. F., Visser, R., et al. 2007b, A&A, 476, 279 [NASA ADS] [CrossRef] [EDP Sciences] [Google Scholar]
- Geers, V. C., van Dishoeck, E. F., Pontoppidan, K. M., et al. 2009, A&A, 495, 837 [NASA ADS] [CrossRef] [EDP Sciences] [Google Scholar]
- Grant, S. L., Stapper, L. M., Hogerheijde, M. R., et al. 2023, AJ, 166, 147 [NASA ADS] [CrossRef] [Google Scholar]
- Guilloteau, S., Denis-Alpizar, O., Dutrey, A., et al. 2025, A&A, 700, L5 [NASA ADS] [CrossRef] [EDP Sciences] [Google Scholar]
- Habart, E., Natta, A., & Krügel, E. 2004a, A&A, 427, 179 [NASA ADS] [CrossRef] [EDP Sciences] [Google Scholar]
- Habart, E., Testi, L., Natta, A., & Carbillet, M. 2004b, ApJ, 614, L129 [NASA ADS] [CrossRef] [Google Scholar]
- Habart, E., Natta, A., Testi, L., & Carbillet, M. 2006, A&A, 449, 1067 [NASA ADS] [CrossRef] [EDP Sciences] [Google Scholar]
- Habing, H. J. 1968, Bull. Astron. Inst. Netherlands, 19, 421 [Google Scholar]
- Herczeg, G. J., & Hillenbrand, L. A. 2014, ApJ, 786, 97 [Google Scholar]
- Hildebrand, R. H. 1983, QJRAS, 24, 267 [NASA ADS] [Google Scholar]
- Kama, M., Bruderer, S., Carney, M., et al. 2016, A&A, 588, A108 [NASA ADS] [CrossRef] [EDP Sciences] [Google Scholar]
- Kelly, B. C. 2007, ApJ, 665, 1489 [Google Scholar]
- Lagage, P.-O., Doucet, C., Pantin, E., et al. 2006, Science, 314, 621 [Google Scholar]
- Lange, K., Dominik, C., & Tielens, A. G. G. M. 2021, A&A, 653, A21 [NASA ADS] [CrossRef] [EDP Sciences] [Google Scholar]
- Lange, K., Dominik, C., & Tielens, A. G. G. M. 2023, A&A, 674, A200 [NASA ADS] [CrossRef] [EDP Sciences] [Google Scholar]
- Leemker, M., Booth, A. S., van Dishoeck, E. F., et al. 2022, A&A, 663, A23 [NASA ADS] [CrossRef] [EDP Sciences] [Google Scholar]
- Ligterink, N. F. W., & Minissale, M. 2023, A&A, 676, A80 [NASA ADS] [CrossRef] [EDP Sciences] [Google Scholar]
- Ligterink, N. F. W., Pinilla, P., van der Marel, N., et al. 2024, Nat. Astron., 8, 1257 [Google Scholar]
- Long, F., Andrews, S. M., Vega, J., et al. 2021, ApJ, 915, 131 [NASA ADS] [CrossRef] [Google Scholar]
- Maaskant, K. M., Min, M., Waters, L. B. F. M., & Tielens, A. G. G. M. 2014, A&A, 563, A78 [NASA ADS] [CrossRef] [EDP Sciences] [Google Scholar]
- Manara, C. F., Ansdell, M., Rosotti, G. P., et al. 2023, in Astronomical Society of the Pacific Conference Series, Protostars and Planets VII, eds. S. Inutsuka, Y. Aikawa, T. Muto, K. Tomida, & M. Tamura, 534, 539 [Google Scholar]
- Meeus, G., Waters, L. B. F. M., Bouwman, J., et al. 2001, A&A, 365, 476 [CrossRef] [EDP Sciences] [Google Scholar]
- Minissale, M., Aikawa, Y., Bergin, E., et al. 2022, ACS Earth Space Chem., 6, 597 [NASA ADS] [CrossRef] [Google Scholar]
- Orihara, R., Momose, M., Muto, T., et al. 2023, PASJ, 75, 424 [CrossRef] [Google Scholar]
- Peeters, E., Spoon, H. W. W., & Tielens, A. G. G. M. 2004, ApJ, 613, 986 [NASA ADS] [CrossRef] [Google Scholar]
- Pinilla, P., Benisty, M., & Birnstiel, T. 2012, A&A, 545, A81 [NASA ADS] [CrossRef] [EDP Sciences] [Google Scholar]
- Pinilla, P., Birnstiel, T., & Walsh, C. 2015, A&A, 580, A105 [NASA ADS] [CrossRef] [EDP Sciences] [Google Scholar]
- Pinilla, P., Tazzari, M., Pascucci, I., et al. 2018, ApJ, 859, 32 [Google Scholar]
- Pinte, C., Ménard, F., Duchêne, G., et al. 2018, A&A, 609, A47 [NASA ADS] [CrossRef] [EDP Sciences] [Google Scholar]
- Qi, C., Öberg, K. I., Espaillat, C. C., et al. 2019, ApJ, 882, 160 [Google Scholar]
- Rapacioli, M., & Spiegelman, F. 2009, Eur. Phys. J. D, 52, 55 [NASA ADS] [CrossRef] [Google Scholar]
- Siebenmorgen, R., & Krügel, E. 2010, A&A, 511, A6 [NASA ADS] [CrossRef] [EDP Sciences] [Google Scholar]
- Sturm, J. A., McClure, M. K., Harsono, D., et al. 2024, A&A, 689, A92 [NASA ADS] [CrossRef] [EDP Sciences] [Google Scholar]
- Temmink, M., Booth, A. S., van der Marel, N., & van Dishoeck, E. F. 2023, A&A, 675, A131 [NASA ADS] [CrossRef] [EDP Sciences] [Google Scholar]
- Temmink, M., Booth, A. S., Leemker, M., et al. 2025, A&A, 693, A101 [NASA ADS] [CrossRef] [EDP Sciences] [Google Scholar]
- Tripathi, A., Andrews, S. M., Birnstiel, T., & Wilner, D. J. 2017, ApJ, 845, 44 [Google Scholar]
- van Boekel, R., Waters, L. B. F. M., Dominik, C., et al. 2004, A&A, 418, 177 [NASA ADS] [CrossRef] [EDP Sciences] [Google Scholar]
- van der Marel, N. 2023, Eur. Phys. J. Plus, 138, 225 [NASA ADS] [CrossRef] [Google Scholar]
- van der Marel, N., & Mulders, G. D. 2021, AJ, 162, 28 [NASA ADS] [CrossRef] [Google Scholar]
- van der Marel, N., van Dishoeck, E. F., Bruderer, S., et al. 2016, A&A, 585, A58 [NASA ADS] [CrossRef] [EDP Sciences] [Google Scholar]
- van der Marel, N., Williams, J. P., Ansdell, M., et al. 2018, ApJ, 854, 177 [Google Scholar]
- van der Marel, N., Dong, R., di Francesco, J., Williams, J. P., & Tobin, J. 2019, ApJ, 872, 112 [Google Scholar]
- van der Marel, N., Birnstiel, T., Garufi, A., et al. 2021a, AJ, 161, 33 [Google Scholar]
- van der Marel, N., Booth, A. S., Leemker, M., van Dishoeck, E. F., & Ohashi, S. 2021b, A&A, 651, L5 [NASA ADS] [CrossRef] [EDP Sciences] [Google Scholar]
- van der Marel, N., Bosman, A. D., Krijt, S., Mulders, G. D., & Bergner, J. B. 2021c, A&A, 653, L9 [NASA ADS] [CrossRef] [EDP Sciences] [Google Scholar]
- Vioque, M., Oudmaijer, R. D., Baines, D., Mendigutía, I., & Pérez-Martínez, R. 2018, A&A, 620, A128 [NASA ADS] [CrossRef] [EDP Sciences] [Google Scholar]
- Visser, R., Geers, V. C., Dullemond, C. P., et al. 2007, A&A, 466, 229 [NASA ADS] [CrossRef] [EDP Sciences] [Google Scholar]
- Wölfer, L., Facchini, S., van der Marel, N., et al. 2023, A&A, 670, A154 [CrossRef] [EDP Sciences] [Google Scholar]
- Wu, Y.-L., Sheehan, P. D., Males, J. R., et al. 2017, ApJ, 836, 223 [CrossRef] [Google Scholar]
- Yang, H., Fernández-López, M., Li, Z.-Y., et al. 2024, ApJ, 963, 134 [NASA ADS] [CrossRef] [Google Scholar]
- Yoffe, G., van Boekel, R., Li, A., et al. 2023, A&A, 674, A57 [NASA ADS] [CrossRef] [EDP Sciences] [Google Scholar]
- Zhang, K., Booth, A. S., Law, C. J., et al. 2021, ApJS, 257, 5 [NASA ADS] [CrossRef] [Google Scholar]
- Zhu, Z., Zhang, S., Jiang, Y.-F., et al. 2019, ApJ, 877, L18 [NASA ADS] [CrossRef] [Google Scholar]
Appendix A ALMA gallery
This Appendix contains the ALMA images analyzed in this work.
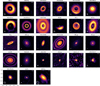 |
Fig. A.1 Gallery ALMA continuum images of the targets in this study. The images are shown with a arcsinh stretch to enhance faint features. The stellar position is indicated with a plus sign and the beam size is shown in the lower left corner of each image. The images are 2″×2″ except for HD142527, which is 4″×4″ due to the larger ring size. |
Appendix B SEDs of transition disks
In this section we present the spectral energy distributions (SEDs) and mid-plane temperature profiles of the transition disks in this study based on RADMC-3D modeling, since their temperature cannot be estimated with a simple power law.
For HD135344B, HD169142, and HD97048, SED radiative transfer modeling was performed by van der Marel et al. (2019), and we use their derived temperature profiles. For IRS48, we use the mid-plane temperature profile from van der Marel et al. (2021b) and for HD142527, we use the profile from Temmink et al. (2023).
For the other transition disks, no SED fits with temperature profiles were available in the literature, so we fit RADMC-3D models ourselves. The SEDs were constructed using photometry from Johnson BVR, Gaia, 2MASS, WISE, Spitzer, IRAS, Herschel/PACS and ALMA millimeter fluxes from this study. The optical-near infrared photometric data points were corrected for extinction using the AV values from Francis & van der Marel (2020). For the fitting itself we follow a similar procedure as Temmink et al. (2023, Appendix E), but with a power-law surface density with an empty cavity inside cavity radius rcav and an inner dust disk of 1 au which is depleted by a factor δdust. The outer radius is set at 150 au and the surface density is scaled to the total gas disk mass Mdisk with a gas-to-dust ratio of 100. The dust opacities are computed using a combination of a small grain and large grain population, of 0.005-1 μm and 0.005-1000 μm, respectively. The vertical scale height is described by h(r) = hc(r/rc)ψ with ψ = 0.15 and characteristic radius rc=50 au. Stellar parameters are taken from Table 1.
The free parameters in the model are thus the total disk mass Mdisk, the vertical height hc at characteristic radius rc, the cavity radius rcav and inner disk depletion factor δdust. The models were fit to both the radial continuum profiles and the SEDs. The final SEDs with their best fit models are shown in Figure B.1 and the best-fit parameters are given in Table B.1. For T Cha, the SED fit had to be run at lower inclination than for the continuum image due to the obscuration of the star by the inner disk, indicating that the inner disk may be misaligned with the outer disk, similar to RY Lup (van der Marel et al. 2018).
Best-fit parameters SEDs
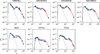 |
Fig. B.1 SEDs of the transition disks for which radiative transfer models were run. The plots show the best-fit models and photometry. |
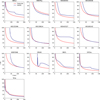 |
Fig. B.2 Temperature profiles of the best-fit radiative transfer models to the SEDs of the transition disks in this study. The red curve in each plot shows the expected temperature profile according to the power-law estimate. This is generally an underestimate of the actual temperature due to the irradiated cavity wall. |
All Tables
Sample of disks in this study, based on PAH studies by Habart et al. (2004a) and Geers et al. (2006).
Subsample of targets with long-wavelength PAH intensities; original data from Acke et al. (2010).
All Figures
|
Fig. 1 Graphic of the proposed scenario of sublimation in a disk with a warm dust trap, viewed from the side, based on van der Marel et al. (2021b). If the bulk of the dust content is located in a dust trap inside the CO snowline at 30 K, this implies that fragments of its icy pebbles can be transported vertically to the higher disk layers above the H2O snow surface at 150 K, and sublimate their icy content into the gasphase, where it becomes observable. If the bulk of the pebbles is located outside the CO snowline, its icy layers may remain frozen out and its contents are not revealed in the gas phase. Such a scenario may also apply to PAHs, which is the hypothesis of this work. |
| In the text | |
|
Fig. 2 Azimuthally averaged profiles of the ALMA continuum images (see Figure A.1) of the targets in this study. The profiles are normalized to the peak and shown in logarithmic scale. The beam size is indicated with a horizontal blue bar (top right of each profile). The pink shaded region shows the CO snowline in each disk, as defined by the 22-30 K temperature regime, based on the derived temperature profile (see text). For IRS 48, the snowline is beyond the shown radial range. The part of the profile to the left of the pink region is considered the warm dust region, where at least part of the ice is sublimated, potentially releasing PAHs. |
| In the text | |
|
Fig. 3 3.3 μm PAH intensity as a function of various stellar and disk parameters. From left to right are shown the parameter χ (FUV radiation field at 150 au from the star) and the FUV radiation field at the inner disk edge Rin and at the disk outer edge Rsize. The rightmost panel shows the 3.3 μm PAH intensity as a function of the total disk dust mass. Upper limits are indicated as empty circles with arrows. The Pearson correlation coefficient is indicated in the lower left corner of each panel. |
| In the text | |
|
Fig. 4 3.3 μm PAH intensity as a function of the warm dust mass, computed from the millimeter flux inside the 30 K radius (CO snowline). The different colors represent the transition disks (TDs, red), compact disks (CDs, blue), and ring disks (RDs, purple). Upper limits are indicated as empty circles with arrows. The dashed line shows the best linear fit for the data points with the gray lines showing the spread between the fits. The fit has a Pearson coefficient of r = 0.88 ± 0.07 and the data are strongly correlated. |
| In the text | |
|
Fig. 5 PAH intensity as a function of warm dust mass for the long wavelength features at 6.2, 8.6, and 11.3 μm, as well as the 3.3 μm for the subsample for which the other PAH features were available (Table 2). |
| In the text | |
|
Fig. 6 Radial profiles of the 13CO 3-2 or 2-1 line (red) and ALMA continuum (gray), in combination with the maximum spatial extent of the PAH 3.3 μm emission (plum bar), and the derived spatial profiles of the PAH 8.6 (purple) and PAH 11.3 (indigo) features when available. The spatial extent is not constrained for the inner edge of the disk, so the inner region (PSF radius) is indicated as dotted rather than solid in the horizontal bar. For IRS 48, the spatial extent is only available for the 8.6 and 11.3 features. For HD 169142, the 11.3 emission is consistent with a ring (Devinat et al. 2022; Yoffe et al. 2023), which is overplotted as a dotted line. The 13CO curves are from Wölfer et al. (2023) and Zhang et al. (2021); the continuum curves are from this work. For HD 100453 12CO 3-2 is plotted instead of 13CO 3-2, as they are the only available line data for this source. The spatial extent of the PAH emission is generally just inside the dust cavity. |
| In the text | |
|
Fig. A.1 Gallery ALMA continuum images of the targets in this study. The images are shown with a arcsinh stretch to enhance faint features. The stellar position is indicated with a plus sign and the beam size is shown in the lower left corner of each image. The images are 2″×2″ except for HD142527, which is 4″×4″ due to the larger ring size. |
| In the text | |
|
Fig. B.1 SEDs of the transition disks for which radiative transfer models were run. The plots show the best-fit models and photometry. |
| In the text | |
|
Fig. B.2 Temperature profiles of the best-fit radiative transfer models to the SEDs of the transition disks in this study. The red curve in each plot shows the expected temperature profile according to the power-law estimate. This is generally an underestimate of the actual temperature due to the irradiated cavity wall. |
| In the text | |
Current usage metrics show cumulative count of Article Views (full-text article views including HTML views, PDF and ePub downloads, according to the available data) and Abstracts Views on Vision4Press platform.
Data correspond to usage on the plateform after 2015. The current usage metrics is available 48-96 hours after online publication and is updated daily on week days.
Initial download of the metrics may take a while.