Fig. 4
Download original image
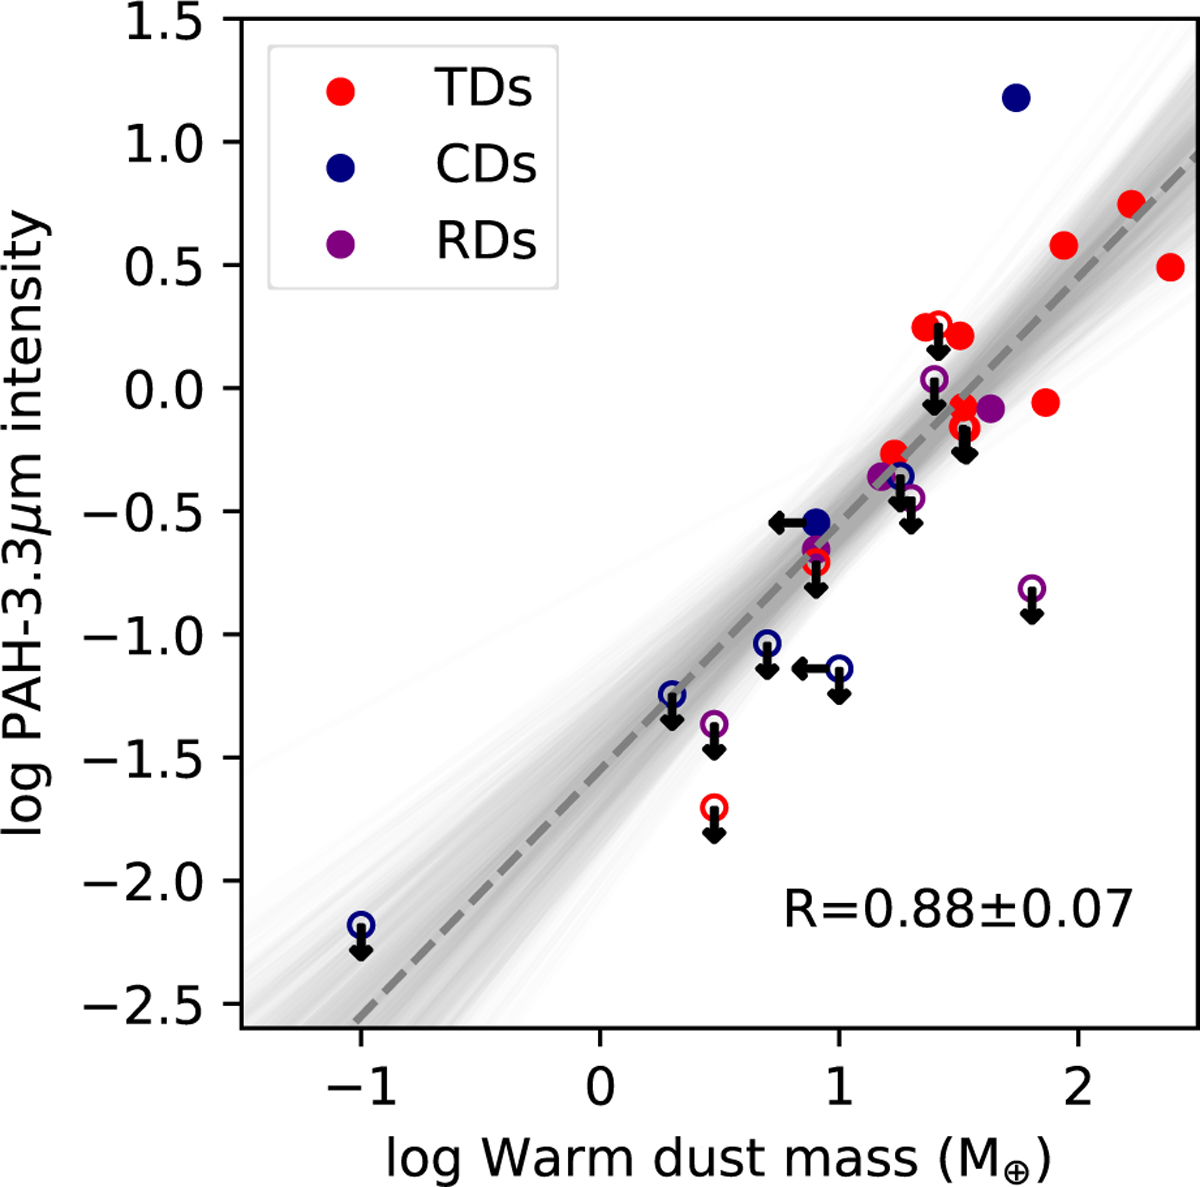
3.3 μm PAH intensity as a function of the warm dust mass, computed from the millimeter flux inside the 30 K radius (CO snowline). The different colors represent the transition disks (TDs, red), compact disks (CDs, blue), and ring disks (RDs, purple). Upper limits are indicated as empty circles with arrows. The dashed line shows the best linear fit for the data points with the gray lines showing the spread between the fits. The fit has a Pearson coefficient of r = 0.88 ± 0.07 and the data are strongly correlated.
Current usage metrics show cumulative count of Article Views (full-text article views including HTML views, PDF and ePub downloads, according to the available data) and Abstracts Views on Vision4Press platform.
Data correspond to usage on the plateform after 2015. The current usage metrics is available 48-96 hours after online publication and is updated daily on week days.
Initial download of the metrics may take a while.