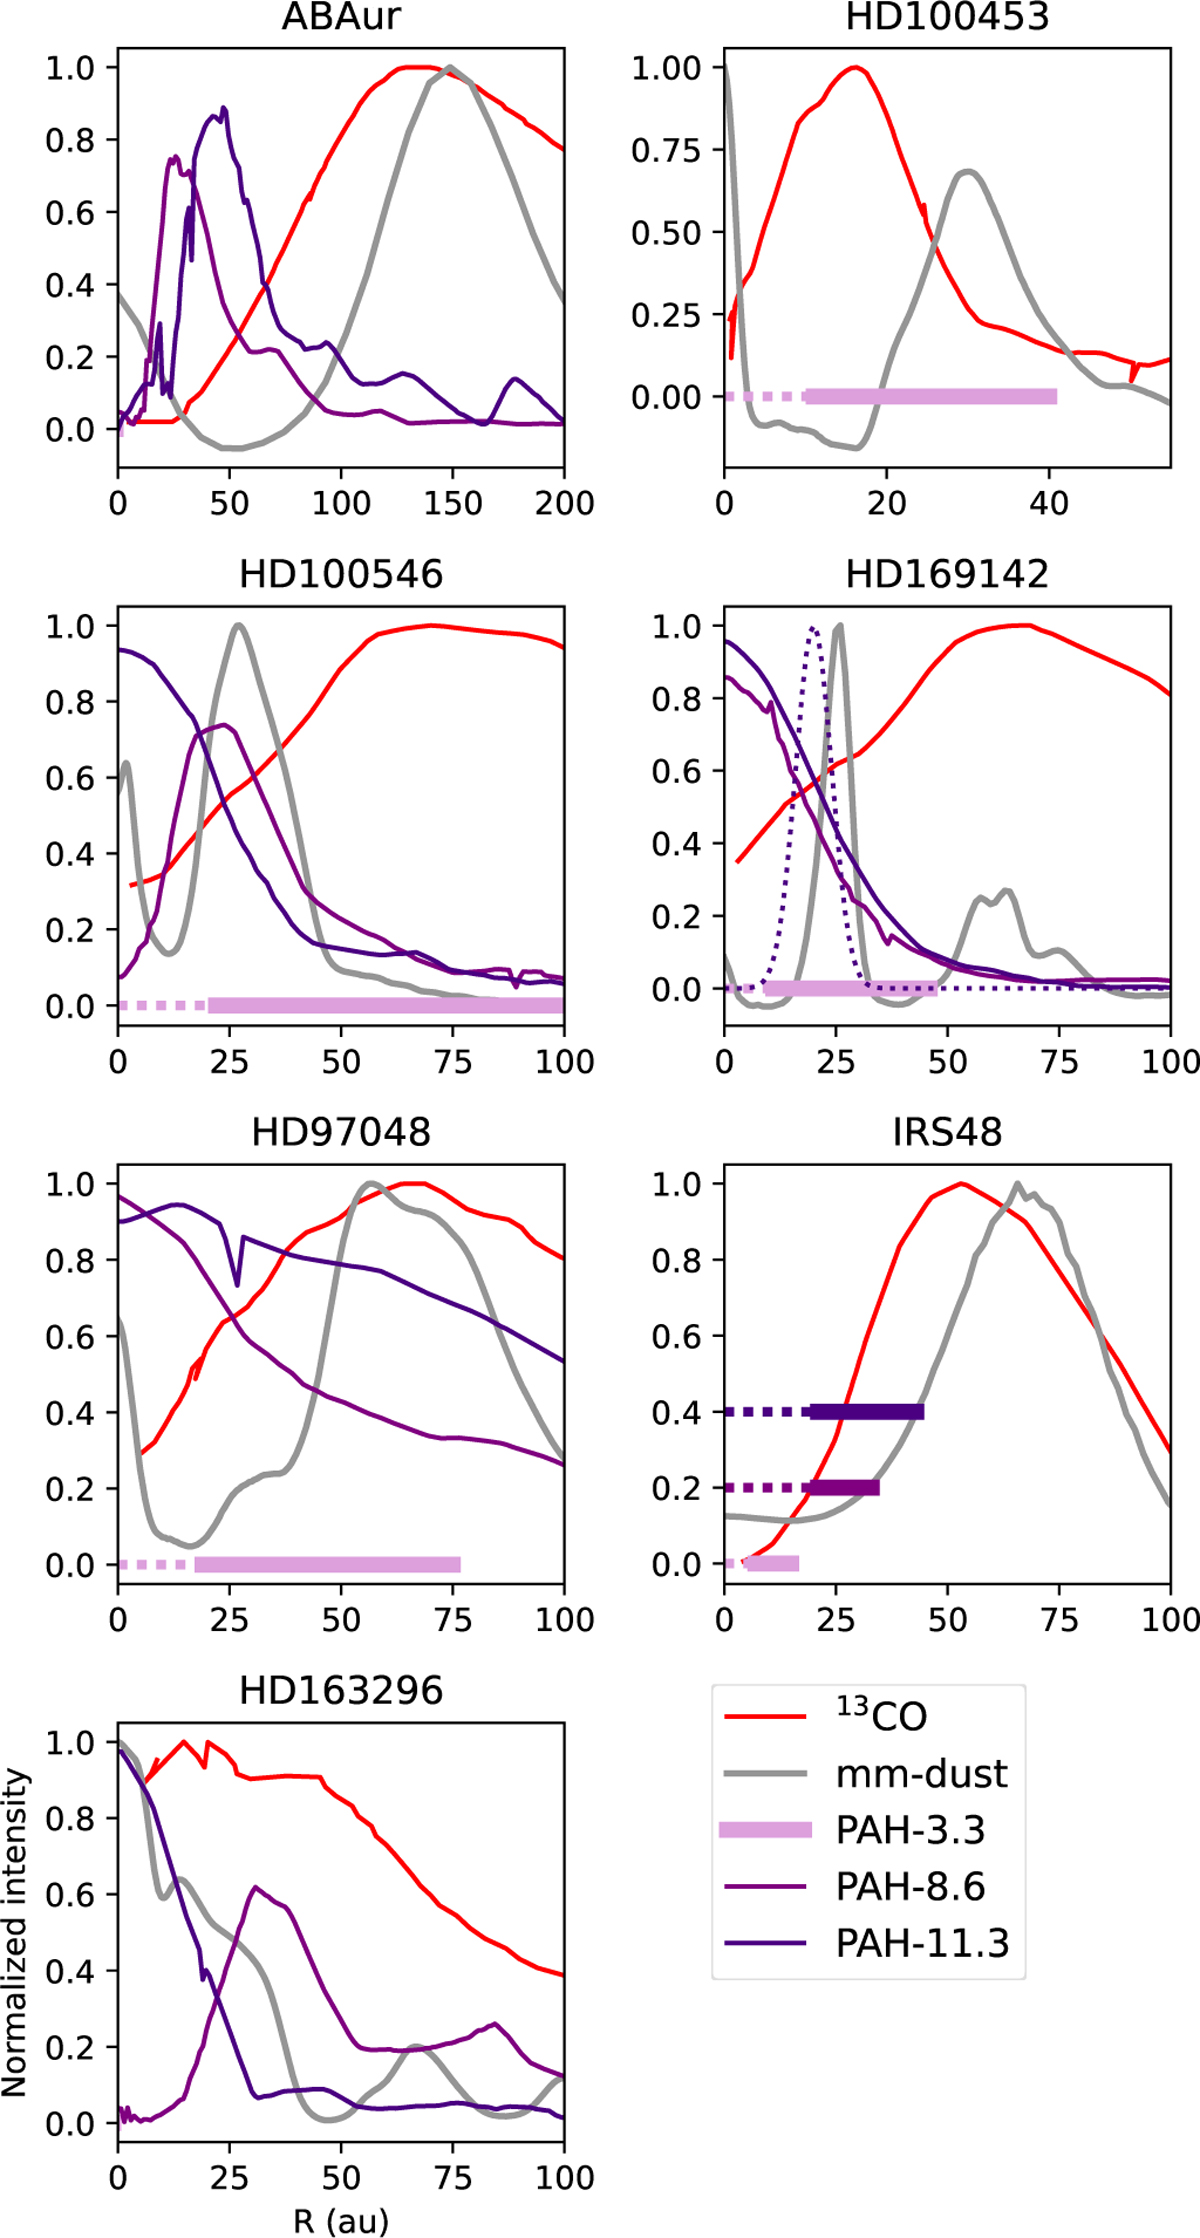
Fig. 6
Download original image
Radial profiles of the 13CO 3-2 or 2-1 line (red) and ALMA continuum (gray), in combination with the maximum spatial extent of the PAH 3.3 μm emission (plum bar), and the derived spatial profiles of the PAH 8.6 (purple) and PAH 11.3 (indigo) features when available. The spatial extent is not constrained for the inner edge of the disk, so the inner region (PSF radius) is indicated as dotted rather than solid in the horizontal bar. For IRS 48, the spatial extent is only available for the 8.6 and 11.3 features. For HD 169142, the 11.3 emission is consistent with a ring (Devinat et al. 2022; Yoffe et al. 2023), which is overplotted as a dotted line. The 13CO curves are from Wölfer et al. (2023) and Zhang et al. (2021); the continuum curves are from this work. For HD 100453 12CO 3-2 is plotted instead of 13CO 3-2, as they are the only available line data for this source. The spatial extent of the PAH emission is generally just inside the dust cavity.
Current usage metrics show cumulative count of Article Views (full-text article views including HTML views, PDF and ePub downloads, according to the available data) and Abstracts Views on Vision4Press platform.
Data correspond to usage on the plateform after 2015. The current usage metrics is available 48-96 hours after online publication and is updated daily on week days.
Initial download of the metrics may take a while.