Open Access
Fig. B.2
Download original image
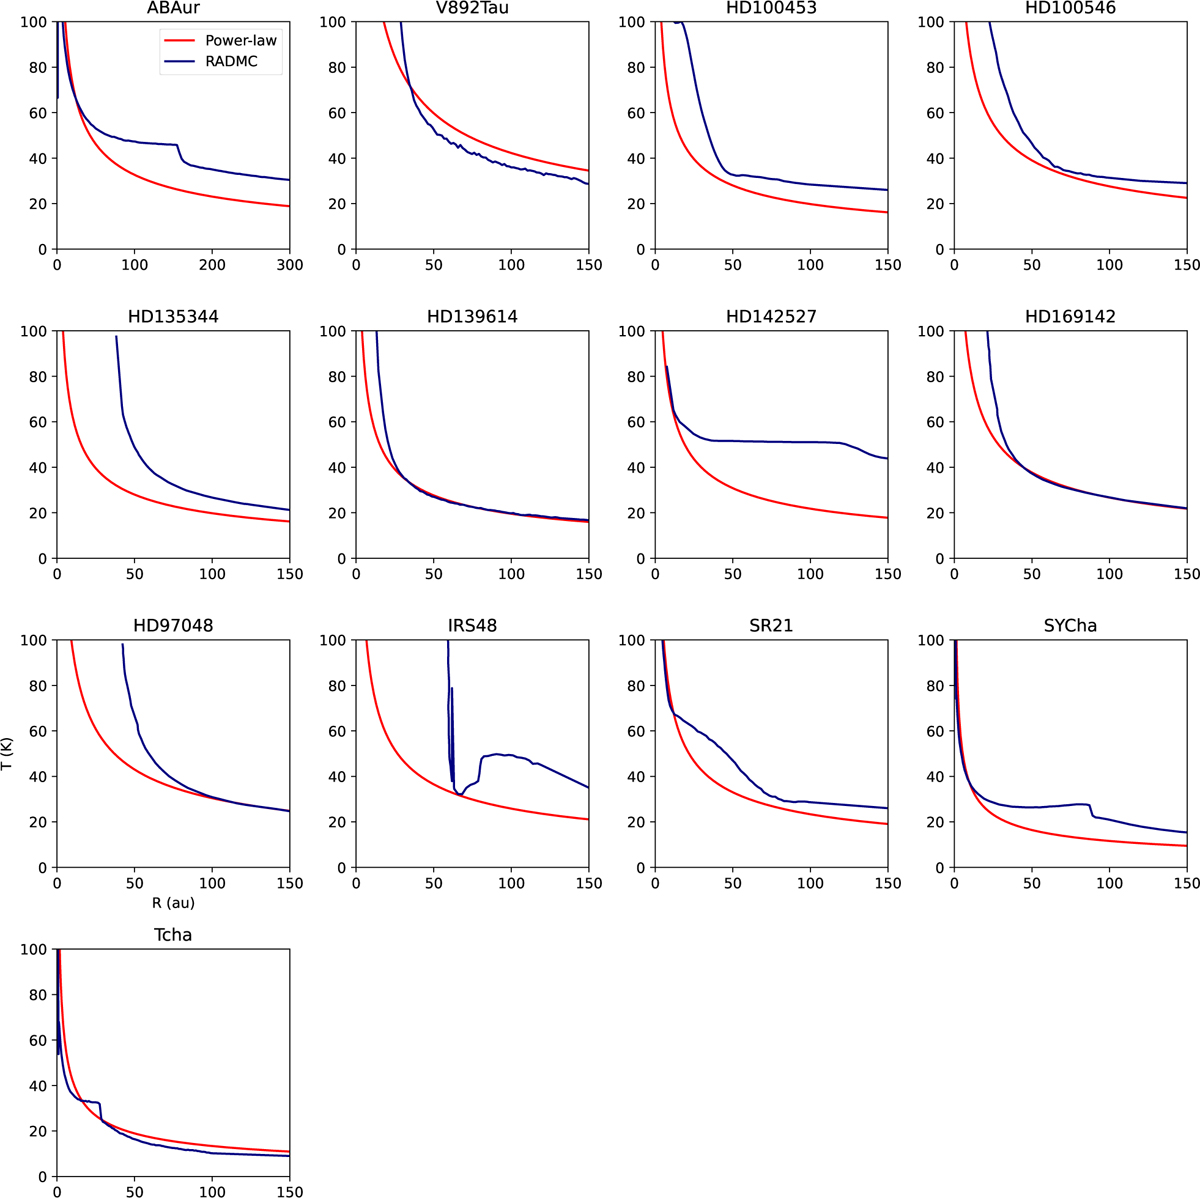
Temperature profiles of the best-fit radiative transfer models to the SEDs of the transition disks in this study. The red curve in each plot shows the expected temperature profile according to the power-law estimate. This is generally an underestimate of the actual temperature due to the irradiated cavity wall.
Current usage metrics show cumulative count of Article Views (full-text article views including HTML views, PDF and ePub downloads, according to the available data) and Abstracts Views on Vision4Press platform.
Data correspond to usage on the plateform after 2015. The current usage metrics is available 48-96 hours after online publication and is updated daily on week days.
Initial download of the metrics may take a while.