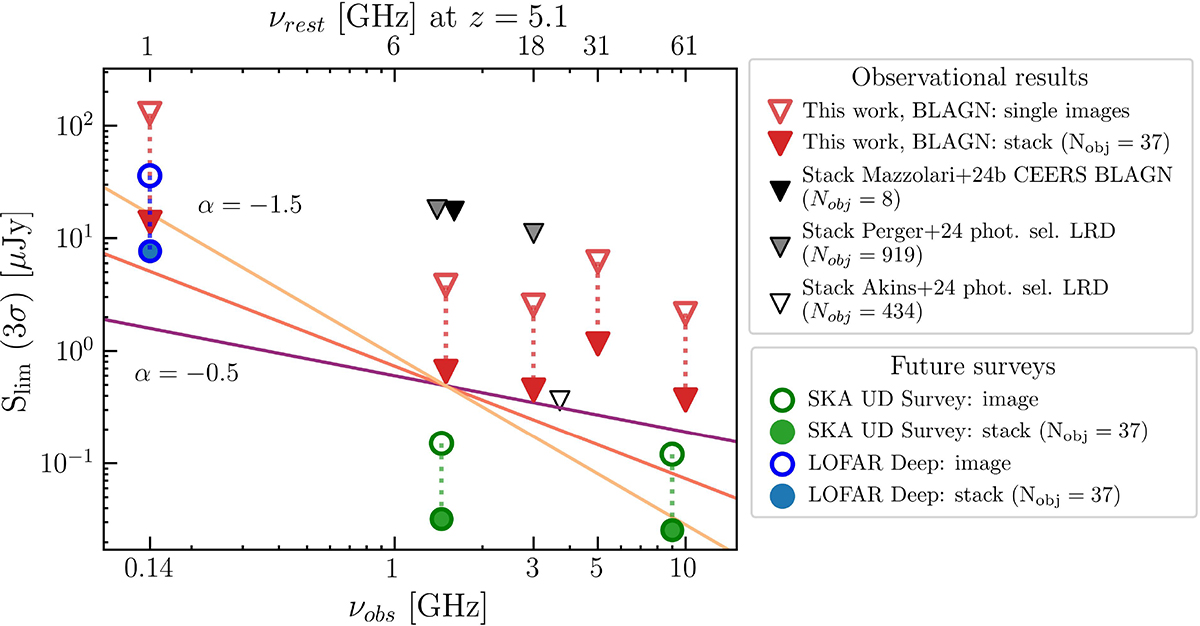
Fig. 2.
Download original image
Distribution of the radio 3σ upper limits obtained at the frequencies of the images described in Sect. 2.2. With empty red triangles and filled red triangles we show the sensitivities of the radio images and of the stack, respectively. The green empty circles refer to the sensitivities of the SKAO UD radio survey at ∼1 GHz and ∼10 GHz. The blue empty circle refers to the LOFAR deep radio image of the GOODS-N field. The filled blue and green circles refer to the sensitivities that would be reached considering the stack of the 37 BLAGN investigated in this work on the deep LOFAR and UD SKAO images, to be compared with the stack achieved in the currently available images. The black triangle refers to the radio stack of the eight high-z BLAGN performed in Mazzolari et al. (2025) on the AEGIS20 1.4 GHz image (Ivison et al. 2007). Instead, the gray and empty triangles refer to the radio stacks of large samples of photometrically selected LRDs performed in Perger et al. (2025) and Akins et al. (2025).
Current usage metrics show cumulative count of Article Views (full-text article views including HTML views, PDF and ePub downloads, according to the available data) and Abstracts Views on Vision4Press platform.
Data correspond to usage on the plateform after 2015. The current usage metrics is available 48-96 hours after online publication and is updated daily on week days.
Initial download of the metrics may take a while.