| Issue |
A&A
Volume 706, February 2026
|
|
|---|---|---|
| Article Number | A372 | |
| Number of page(s) | 14 | |
| Section | Extragalactic astronomy | |
| DOI | https://doi.org/10.1051/0004-6361/202453317 | |
| Published online | 20 February 2026 | |
The radio properties of the JWST-discovered AGN
1
Dipartimento di Fisica e Astronomia, Universitá di Bologna Via Gobetti 93/2 I-40129 Bologna, Italy
2
INAF – Osservatorio di Astrofisica e Scienza dello Spazio di Bologna Via Gobetti 93/3 I-40129 Bologna, Italy
3
Kavli Institute for Cosmology, University of Cambridge Madingley Road Cambridge CB3 0HA, UK
4
Cavendish Laboratory, University of Cambridge 19 JJ Thomson Avenue Cambridge CB3 0HE, UK
5
Department of Physics and Astronomy, University College London Gower Street London WC1E 6BT, UK
6
INAF – Istituto di Radioastronomia Via Gobetti 101 I-40129 Bologna, Italy
7
The William H. Miller III Department of Physics & Astronomy, Johns Hopkins University Baltimore MD, USA
8
Space Telescope Science Institute for the European Space Agency (ESA), ESA Office 3700 San Martin Drive Baltimore MD, USA
9
National Radio Astronomy Observatory, 520 Edgemont Road Charlottesville VA 22903 USA
10
Instituto de Radioastronomía y Astrofísica, Universidad Nacional Autónomia de México, Antigua Carretera a Pátzcuaro # 8701 Ex-Hda. San José de la Huerta Morelia Michoacán C.P 58089, Mexico
11
Max Planck Institut für Astronomie Königstuhl 17 D-69117 Heidelberg, Germany
12
National Radio Astronomy Observatory Observatory, 1011 Lopezville Rd., P.O. Box O Socorro, NM 87801, USA
13
Dipartimento di Fisica e Astronomia, Universitá di Firenze via G. Sansone 1 50019 Sesto Fiorentino Firenze, Italy
14
INAF – Osservatorio Astrofisico di Arcetri Largo Enrico Fermi 5 I-50125 Firenze, Italy
15
Dipartimento di Matematica e Fisica, Univeristá di Roma 3, Via della Vasca Navale 84 00146 Roma RM, Italy
16
Institute of Astronomy, University of Cambridge Madingley Road CB3 0HA, UK
17
Max-Planck-Institut für extraterrestrische Physik (MPE) Gießenbachstraße 1 85748 Garching, Germany
18
Jodrell Bank Centre for Astrophysics, School of Physics & Astronomy, The University of Manchester, Alan Turing Building Oxford Road Manchester M13 9PL, UK
★ Corresponding author: This email address is being protected from spambots. You need JavaScript enabled to view it.
Received:
5
December
2024
Accepted:
1
August
2025
Abstract
The James Webb Space Telescope (JWST) has discovered a large population of active galactic nuclei (AGN) in the early Universe. A large fraction of these AGN revealed a significant lack of X-ray emission; the observed X-ray luminosity upper limits were 2–3 dex lower than expected. We explored the radio emission of these AGN, focusing on the JWST-selected broad-line AGN (BLAGN, or type 1) in the GOODS-N field, one of the fields with the best combination of deep radio observations and statistics of JWST-selected, spectroscopically confirmed BLAGN. We used deep radio data at different frequencies (144 MHz, 1.5 GHz, 3 GHz, 5.5 GHz, 10 GHz), and we find that none of the 37 sources investigated is detected at any of these frequencies. Similarly, the radio stacking analysis does not reveal any detection down to an rms of ∼0.15 μJy beam−1, corresponding to a 3σ upper limit at rest frame 5 GHz of L5GHz = 2 × 1039 erg s−1 at the mean redshift of the sample z ∼ 5.1. We compared this and the upper limits of the individual sources with expected radio luminosities estimated assuming different AGN scaling relations to check whether they are consistent with the standard BLAGN spectral energy distribution. For most of the sources the radio luminosity upper limits are still compatible with expectations for radio-quiet (RQ) AGN; nevertheless, the more stringent stacking upper limits and the fact that no detection is found might suggest that JWST-selected BLAGN are weaker than standard AGN, even at radio frequencies. The probability of having none of the BLAGN detected in none of the investigated radio images is expected to be on average very low (P < 10−4). We discuss some scenarios that could explain the possible radio weakness, such as free-free absorption from a dense medium or the lack of either a magnetic field or a corona, possibly as a consequence of super-Eddington accretion. These scenarios would also explain the observed X-ray weakness. We also conclude that ∼1 dex more sensitive radio observations are needed to better constrain the level of radio emission (or lack thereof) for the bulk of these sources. The Square Kilometer Array Observatory (SKAO) will likely play a crucial role in assessing the properties of this AGN population.
Key words: galaxies: active / galaxies: high-redshift / radio continuum: galaxies
© The Authors 2026
 Open Access article, published by EDP Sciences, under the terms of the Creative Commons Attribution License (https://creativecommons.org/licenses/by/4.0), which permits unrestricted use, distribution, and reproduction in any medium, provided the original work is properly cited.
This article is published in open access under the Subscribe to Open model.
Open Access funding provided by Max Planck Society.
1. Introduction
The James Webb Space Telescope (JWST) has enabled the discovery of a large population of broad-line active galactic nuclei (BLAGN, or type 1) at z > 4, identified via the detection of a broad emission component (full width at half maximum ≳1000 km/s) in the permitted lines (Hα and/or Hβ). No broad emission is observed in the forbidden lines, such as [O III] λ5007, hence excluding an outflow origin and indicating that the broad permitted lines originate in the broad-line regions (BLRs) of AGN (e.g., Harikane et al. 2023; Maiolino et al. 2024a; Kocevski et al. 2023; Übler et al. 2023; Taylor et al. 2025).
This large population of AGN has several peculiar properties. About 10–30% of them have very red optical colors, and are therefore dubbed little red dots (LRDs; e.g., Matthee et al. 2024; Hainline et al. 2025; Kocevski et al. 2025). They are offset from the population of local AGN in classical emission-line diagnostic diagrams, such as the BPT diagrams (e.g., Mazzolari et al. 2025; Übler et al. 2023; Maiolino et al. 2024a; Harikane et al. 2023), and lack prominent Fe II emission typical of low-redshift AGN (Trefoloni et al. 2025), possibly due to low metallicity both in the narrow-line region (NLR) and in the broad-line region (BLR).
One additional and unexpected property characterizing the large majority of these AGN is that their X-ray luminosities are orders of magnitude lower than expected assuming the standard BLAGN spectral energy distribution (SED Duras et al. 2020), thus showing a significant X-ray weakness. Yue et al. (2024), Ananna et al. (2024), and Maiolino et al. (2025), analyzing the X-ray properties of ∼50 of these BLAGN found that only very few of them are X-ray detected (1–3%), even though some of them are found in fields where the deepest X-ray observations have ever been performed, such as the 7Ms Chandra Deep Field South (CDFS; Liu et al. 2017) or the 2Ms Chandra Deep Field North (CDFN; Xue et al. 2016). Even the stack of these objects did not reveal any detection down to X-ray luminosity L2−10 keV ≃ 1041 erg s−1, i.e., ∼2 − 3 dex lower than expected. Different scenarios have been invoked to explain this unexpected property. As outlined in Maiolino et al. (2025) and Juodžbalis et al. (2024a), one possibility is X-ray absorption by high Compton-thick (CTK) hydrogen column densities of dust-poor gas, which would still allow the detection of the broad optical lines. BLR clouds represent an optimal candidate to explain this scenario given their larger column densities (Risaliti et al. 2011; Juodžbalis et al. 2024a) and because they are almost dust-free, provided that their covering factor is much larger (∼4π) than for local AGN (which seems supported by the large equivalent width of the broad component of Hα). Another possibility is an intrinsic X-ray weakness due to a steep X-ray power spectrum, similar to the one observed in narrow-line Seyfert 1 (NLS1), which, in particular at high redshift, would move most of the X-ray emission out of the observing bands of Chandra. Other possible causes of X-ray weakness are the lack of an X-ray-emitting corona, or a much lower efficiency of the corona in producing X-ray photons (Yue et al. 2024; Maiolino et al. 2025). Pacucci & Narayan (2024), Madau & Haardt (2024), Lambrides et al. (2024), and King (2025) have recently proposed that super-Eddington accretion can be the origin of the observed X-ray weakness; this would also fit well with the similarities with NLS1, given that this class of AGN are thought to be accreting at high rates.
Even if most of the works agreed in classifying these sources as BLAGN, it has also been proposed that the broad Balmer lines observed in these objects, without a counterpart in [O III] λ5007, might not be associated with the BLR of an AGN, but with other extreme phenomena, such as superluminous supernovae, ultra-dense and extremely metal-poor outflows or nuclear compact star-forming clusters, and Raman scattering (Maiolino et al. 2025; Kokubo & Harikane 2024); however, these alternative explanations fail various observational tests (Maiolino et al. 2025; Juodžbalis et al. 2024a; Inayoshi & Maiolino 2025, Ji et al. in prep.).
Radio observations may provide important clues to the processes at the origin of the observed properties of this new population of high-z AGN discovered thanks to the JWST, and in particular to their X-ray weakness. AGN radio emission is generally much less affected by obscuration than X-ray emission (Mazzolari et al. 2024; Ricci et al. 2023), and a high level of radio emission can be produced by processes associated with supermassive black hole (SMBH) activity (e.g., coronal activity, shocks, small-scale radio jets, see Panessa et al. 2019, for a review) even in systems that are not classical loud (RL) AGN, as demonstrated by the radio-excess AGN selection techniques (Bonzini et al. 2013; Smolčić et al. 2017a; Delvecchio et al. 2017; Whittam et al. 2022). Therefore, in the scenario of X-ray weakness due to obscuration, one might expect to detect X-ray weak AGN in the radio band if the observations are deep enough.
Recently, a few works have investigated the radio properties of high-z AGN or AGN candidates (such as photometrically selected LRDs). Mazzolari et al. (2025) investigated the radio counterparts of eight spectroscopically selected JWST BLAGN (Harikane et al. 2023) over the AEGIS20 radio image (Ivison et al. 2007), but there were no detections, not even from the stack. The measured radio upper limit was consistent with the typical radio-quiet (RQ) AGN luminosities, excluding the possibility that the sources were instead radio-loud (RL), but it was not possible to provide additional constraints as the radio image was too shallow. Akins et al. (2025) studied a sample of 434 photometrically selected LRDs over the COSMOS-web field (Casey et al. 2023), revealing no detections on the COSMOS 3 GHz radio image (Smolčić et al. 2017b) down to ∼0.6 μJy at 5σ from the stack. Perger et al. (2025) also stacked a sample of 919 LRDs (94% of them with only a photometric redshift and no spectroscopic confirmation of the AGN nature) over the Very Large Array Sky Survey (VLASS) and the Faint Images of the Radio Sky at Twenty-centimeters (FIRST) surveys. They obtained 3σ upper limits of ∼11 μJy beam−1 and ∼18 μJy beam−1 from the stack at 3 GHz and 1.4 GHz, respectively. Both Akins et al. (2025) and Perger et al. (2025) find upper limits that are still compatible with expectations for RQ AGN. It is important to note, however, that photometrically selected samples of LRD can be highly contaminated by dusty star-forming galaxies and quiescent galaxies, as demonstrated in Pérez-González et al. (2023). At the same time, LRDs seem to constitute only a minor fraction of the global high-redshift BLAGN population (∼30%), given that high-z BLAGN are observed to span a broad distribution of colors and slopes (Hainline et al. 2025).
For this work our aim was to investigate the radio properties of spectroscopically confirmed JWST-selected BLAGN at multiple radio frequencies in order to provide a uniform and complete characterization of their radio emission. Based on available radio images and the location of JWST-selected BLAGN discovered to date, the GOODS-N field provides the best combination of radio sensitivity and BLAGN statistics. Hence, we focused our analysis on this field.
The paper is organized as follows. In Sect. 2 we present the sample of BLAGN studied in this work and the radio images used for our analysis. In Sect. 3 we describe the radio stacking procedure, and we present our results in terms of expected radio luminosities versus observed radio luminosities. Finally, in Sect. 4 we discuss different scenarios that can justify a possible radio weakness of these sources.
Throughout the paper we assume a flat ΛCDM universe with H0 = 70 km s−1 Mpc−1, Ωm = 0.3, ΩΛ = 0.7. Unless stated otherwise, we assume a typical AGN radio spectral index of α = −0.5, with Sν ∝ να (Wang et al. 2024; Bariuan et al. 2022). In addition, radio luminosities reported in the form Lν refer to the AGN rest-frame radio luminosities at frequency ν in units of erg s−1.
2. Data
2.1. BLAGN sample
In Table 1, we summarize the main physical properties of the 37 BLAGN investigated in this work and collected from the literature. Despite being drawn from different studies, the selection of these sources is almost uniform. All the sources, except for GNz-11 described in Maiolino et al. (2024b) and Scholtz et al. (2024), were selected as BLAGN based on the detection of a broad Hα emission component not revealed in forbidden lines (such as the [O III] λ5007), therefore indicating an emission coming from the BLR.
Sample of BLAGN selected using JWST spectroscopic data on the GOODS-N field.
The bolometric luminosities (Lbol) of these sources were derived from their broad Hα luminosities using Stern et al. (2012) calibrations. In addition, all the sources are characterized by Eddington ratios λedd > 0.1, indicative of significant accretion rates, except for the z = 6.68 BLAGN presented in Juodžbalis et al. (2024b) showing λedd ∼ 0.01. Different works show that the gas metallicities characterizing these BLAGN are generally well below the solar level (Z ≃ 0.1 Z⊙, Übler et al. 2023; Trefoloni et al. 2025; Maiolino et al. 2025). When available, the estimated stellar masses of their host galaxies range between ∼ 108−109 M⊙, and for most of the sources they are significantly undermassive compared to their SMBH mass and local MBH − M* relations (Maiolino et al. 2024a; Juodžbalis et al. 2024b).
None of these BLAGN is detected in the 2Ms Chandra image of the GOODS-N field, despite being covered by the CDFN observation, which is the second deepest X-ray observation ever performed (with a flux limit of ∼10−17 erg cm−2 s−1, Xue et al. 2016). From X-ray stacking analysis Maiolino et al. (2025), Comastri et al. in prep. inferred a median observed X-ray luminosity upper limit ∼2 − 3 dex lower than expected from standard relations between bolometric and X-ray luminosities observed in optically selected and X-ray selected BLAGN (Duras et al. 2020).
2.2. GOODS-N radio images
To investigate the radio properties of these JWST-selected BLAGN, we used a set of radio images at different frequencies available on the GOODS-N field. At 1.5 GHz we used the radio images produced as part of the first data release of the e-MERLIN Galaxy Evolution (e-MERGE) Survey (Muxlow et al. 2020). These images were obtained by combining ∼140 hr of observations with the enhanced-Multi-Element Remotely Linked Interferometer Network (e-MERLIN) with ∼40 hr with the Very Large Array (VLA). The e-MERGE DR1 released three 1.5 GHz images characterized by different beam-size sensitivity combinations, but all covering a ∼15′×15′ field of view. Among these, we considered the image with the best resolution (0.28 × 0.26 arcsec2), which also has the best point-source sensitivity, reaching an rms noise of 1.17 μJy beam−1.
The 3 GHz radio image (Jimenez-Andrade et al. in prep.) was obtained with 64 hours of VLA observations in the A configuration using the S-band (2–4 GHz) receivers (project ID VLA/22A-317; PI Jiménez-Andrade). Two pointings were needed to provide a nearly homogeneous sensitivity across the GOODS-N field. The point-source sensitivity of the mosaic is 0.76 μJy/beam and the angular resolution is 0.62 × 0.62 arcsec2.
We also considered higher frequency deep radio coverage of the GOODS-N field, in particular, the 5.5 GHz (Guidetti et al. 2017) and 10 GHz (Jiménez-Andrade et al. 2024) surveys, both taken with the VLA, reaching sensitivities of ∼3 μJy beam−1 and ∼0.7 μJy beam−1, and resolutions of 0.5 arcsec and 0.22 arcsec, respectively.
Finally, we considered the second data release of the 144 MHz LOw-Frequency ARray (LOFAR) Two-metre Sky Survey (LoTSS; Shimwell et al. 2022), which includes the GOODS-N field in the surveyed area. The LoTSS survey image has an angular resolution of 6 arcsec and a median rms in the region covered by our sources of ∼70 μJy beam−1. While LOFAR is quite poor in spatial resolution, the subarcsec resolution of the 1–10 GHz images implies we are probing physical scales of 1–4 kpc at the median redshift of the sample.
Covering a wide range of frequencies allows us to account for different shapes of the radio spectra and increases our chances of obtaining a detection of the sources. Assuming typical optically thin synchrotron spectra (radio spectral index α = −0.7), the 1.5 GHz and 3 GHz images are those that provide the best point source sensitivity. Assuming an optically thick flat spectrum population (α = 0) the 3 GHz and 10 GHz images are the most sensitive ones. In the following we use the results obtained at 3 GHz as a reference for the analysis, and we derive 5 GHz rest frame radio luminosities, assuming a typical AGN spectral index of α = −0.5.
3. Methods and results
3.1. Radio stacking
All the 37 BLAGN fall inside the aforementioned radio images, but none of them is detected down to a 3σ level. We hence performed a radio stacking analysis to search for indications of under-threshold radio emission.
The radio stacking was performed as follows. For each of the 37 sources, we made a 10″ × 10″ (or 25″ × 25″ for the LOFAR images) cutout centered on the position of the source. These images were then aligned, performing a pixel-by-pixel stacking considering both a median and a mean stack. We did not consider a weighted mean procedure since all the sources lie in regions of the radio images where the rms noise is fairly uniform. The stacking was performed for all the five radio images described in Sect. 2.2, but in none of them we detected a significant (3σ level) radio emission. The rms noise and the peak brightness densities of each stack are reported in Table 2. In Fig. 1 we show both the median and mean stack performed on all the images investigated in this work. In particular, for the 3 GHz radio image, our reference image, we reached an rms noise of ∼0.2 μJy beam−1. This corresponds to a 3σ upper limit of log L3 GHz = 39.3 erg s−1 or to a 5 GHz rest-frame radio luminosity of log L5 GHz = 39.4 erg s−1 at the median redshift of the sources (z ∼ 5.2).
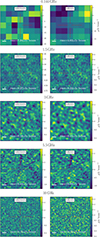 |
Fig. 1. 10″ × 10″ cutouts of the mean (right) and median (left) radio stacking of the 37 JWST-selected BLAGN on the GOODS-N field performed on the images presented in Sect. 2.2. The values of the rms measured in the stacked images are reported in the panels. |
In Fig. 2 we show the upper limits distribution obtained from the stacks of the different images. We also show the upper limits derived by the stacks performed in previous studies (see Sect. 1). In particular, the stacked images analysed in the present work are > 10 times deeper than those in Perger et al. (2025) (919 photometrically selected LRDs) at comparable frequencies. The 3 GHz stack performed in Akins et al. (2025) (434 photometrically selected LRDs) reaches a similar depth to our 3 GHz stack. However, we remark that photometric selections of LRDs likely provide largely contaminated samples, as shown in Pérez-González et al. (2023), and therefore they are not ideal to trace the average properties of BLAGN, like those investigated in this work, which are all spectroscopically confirmed. On the contrary, the radio upper limit derived by Mazzolari et al. (2025) was obtained considering the 8 BLAGN spectroscopically selected by Harikane et al. (2023) among the medium resolution (MR) spectra of the CEERS survey (Finkelstein et al. 2022), i.e., belonging to the same BLAGN population studied here. However, the constraints derived by Mazzolari et al. (2025) are much shallower than those obtained in this work due to the limited sample and the shallower available radio image (∼10 μJy rms).
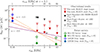 |
Fig. 2. Distribution of the radio 3σ upper limits obtained at the frequencies of the images described in Sect. 2.2. With empty red triangles and filled red triangles we show the sensitivities of the radio images and of the stack, respectively. The green empty circles refer to the sensitivities of the SKAO UD radio survey at ∼1 GHz and ∼10 GHz. The blue empty circle refers to the LOFAR deep radio image of the GOODS-N field. The filled blue and green circles refer to the sensitivities that would be reached considering the stack of the 37 BLAGN investigated in this work on the deep LOFAR and UD SKAO images, to be compared with the stack achieved in the currently available images. The black triangle refers to the radio stack of the eight high-z BLAGN performed in Mazzolari et al. (2025) on the AEGIS20 1.4 GHz image (Ivison et al. 2007). Instead, the gray and empty triangles refer to the radio stacks of large samples of photometrically selected LRDs performed in Perger et al. (2025) and Akins et al. (2025). |
In Fig. 2, we also show the sensitivities of the ongoing deep LOFAR imaging of the GOODS-N field (∼200 hr of observations, likely reaching rms ∼12 μJy; Vacca et al. in prep.), and of the reference Square Kilometre Array (SKA) radio-continuum surveys. In particular we show the SKA survey ultra-deep (UD) tiers at ∼1 GHz and ∼10 GHz, respectively reaching sensitivities of ∼0.05 μJy and ∼0.04 μJy over areas of ∼1 deg2 and ∼0.01 deg2 (Prandoni & Seymour 2015).
In the plot, we also show the sensitivities that would be reached considering the stack of our 37 BLAGN using the future deep LOFAR and UD SKA surveys. Clearly, when SKAO becomes fully operational, we expect much larger samples of JWST-selected BLAGN, given the much larger area that will be covered by these radio surveys, hence these data points obtained considering only 37 objects are just for comparison with our stacked sample. As it is possible to see, the SKA UD surveys will reach a factor of ∼20 deeper sensitivities than currently available at ∼1 GHz and ∼10 GHz, while the GOODS-N LOFAR deep image will be ∼5 times deeper than the currently available LoTSS survey.
The distribution of the stack upper limits obtained with the radio images considered in this work clearly shows that, in the optimistic case of a source with a flux density just below the observed 1.5 GHz 3σ sensitivity, this source would be detectable in the currently available LOFAR image only if characterized by an ultra-steep spectral index α ≲ −1.3. The constraint on the spectral index will become α ≲ −1 if the nondetections would persist when the LOFAR deep observations of the GOODS-N are released.
3.2. Expected radio luminosities
To verify how the radio upper limits that we obtained for these BLAGN (both for the individual sources and for the stack) compare with the AGN expectations, we have to estimate their expected radio luminosities under the assumption that these sources are standard AGN, i.e., that they can be described by standard BLAGN SED in terms of optical, X-rays, and radio emission (Richards et al. 2006; Shang et al. 2011; Liu et al. 2021). Our goal is to test the null hypothesis that the radio emission of these sources is consistent with what is predicted by the standard SED of BLAGN.
There are different scaling relations that can be exploited to estimate the expected radio luminosity for these BLAGN, given the available observational quantities reported in Table 1. In particular, we focus on scaling relations observed for RQ AGN populations, as the luminosity upper limits that we obtain are too faint for a RL AGN population (as demonstrated in Appendix A).
Some of the most thoroughly studied AGN relations involving radio emission are the ones between X-ray and radio luminosity (D’Amato et al. 2022; Panessa et al. 2015; Fan & Bai 2016), as well as the so-called Fundamental Plane (FP) relations (Merloni et al. 2003; Wang et al. 2024; Bariuan et al. 2022). For both these kinds of relations, given the intrinsic AGN X-ray luminosity, and for the FP relations also the SMBH mass, they allow the estimation of the expected radio luminosity. All the JWST-selected BLAGN are undetected in X-rays. However, as reported in Sect. 1, we still do not know whether this is because X-ray photons are produced but are absorbed by a very dense gaseous environment or if it is due to an intrinsic X-ray weakness. We assumed (and therefore tested) the scenario in which the intrinsic X-ray emission of our sources is consistent with the standard relations and its observed weakness is due to absorption. Therefore, we computed their expected intrinsic X-ray luminosities using the direct relation between the luminosity of the broad Hα emission and the 2–10 keV luminosity (Jin et al. 2012). As mentioned above, we are assuming the scenario whereby the intrinsic X-ray and radio emission follow the standard type 1 AGN SED, and we want to test whether this hypothesis is compatible with radio nondetection. Only in this way we can prove whether the JWST-discovered AGN are characterized by a nonstandard emission, even in the radio band. Given the intrinsic L2−10 keV, the expected radio emission is computed considering the X-ray to radio luminosity scaling relation derived by D’Amato et al. (2022) and the FP relation derived by Bariuan et al. (2022). We chose these relations because they were derived considering RQ AGN samples selected from some of the deepest fields in terms of radio and X-ray flux sensitivities (especially the X-ray to radio luminosity relation of D’Amato et al. 2022, see also Mazzolari et al. 2024). In addition, such samples span a large range in redshift, including sources at redshifts comparable to those of the BLAGN studied in this work (the FP relation of Bariuan et al. 2022, was obtained from sources extending up to z ∼ 5). Furthermore, these relations were derived without pre-selecting sources with a specific kind of accretion physics, preventing us from making any a priori assumption on the accretion mechanism of the JWST-selected BLAGN.
Another approach one can follow is to use the well-known relation between the radio luminosity and the dust-corrected [O III] λ5007 luminosity (Xu et al. 1999; de Vries et al. 2007; Berton et al. 2016; Baldi et al. 2019, 2021) observed for both RQ and RL AGN. Here, we considered the one derived in de Vries et al. (2007), considering RQ sources including both bright BLAGN and low radio luminosity AGN from the Sloan Digital Sky Survey (SDSS). The advantage of this approach is that we can directly use the observed [O III] λ5007 luminosities with no need to pass through other quantities. Unfortunately, [O III] λ5007 luminosities are only available for 15 out of the 37 BLAGN; for the other sources the [O III] λ5007 falls outside of the JWST spectral coverage or in a spectral gap. While it is possible that the [O III] λ5007 line might be contaminated by host galaxy emission, we show in Sect. 4.1 that the expected radio luminosity coming from star formation (SF) in these sources is > 1 order of magnitude lower than the AGN value, and therefore it is not expected to significantly contaminate the [O III] λ5007 line as well.
Finally, the radio emission can be estimated by considering the radio loudness parameter R, defined as the ratio between the AGN radio luminosity density at rest-frame 5 GHz (i.e., in erg s−1 Hz−1) and the optical luminosity density (in the rest-frame B band; Kellermann et al. 1989). Different works investigated the intrinsic distribution of the parameter R for optically selected RQ AGN, both from an observational and theoretical perspective (Arnaudova et al. 2024; White et al. 2007; Cirasuolo et al. 2003; Baloković et al. 2012). There is no general consensus on which value of R corresponds to the peak (or mean) of the RQ AGN distribution, but the aforementioned works overall agree in setting it between 0 < log R < 1, while for log R > 1 − 1.5 AGN are generally classified as RL (Bariuan et al. 2022; Kellermann et al. 1989). Therefore, for our analysis we considered two distinct fiducial values of the radio loudness parameter: log R = 0 and log R = 1. Regarding the optical luminosity in the B-band, we cannot simply take the observed value, as for these intermediate luminosity AGN the continuum is generally contributed significantly by the host galaxy’s stellar light (Maiolino et al. 2024a; Juodžbalis et al. 2024b). Therefore, we used the luminosity of the broad component of the Hα line, which is entirely associated with the AGN, and from this we derived the AGN optical luminosity in the rest-frame B band using the scaling relation between the Hα broad emission line and B-band given by Stern et al. (2012). Then we used the assumed R to derive the expected radio luminosity.
3.3. Expected versus observed radio luminosities
In Fig. 3 we show the observed radio luminosities’ upper limits (derived at 3σ) compared with the rest frame 5 GHz expected radio luminosities from various scaling relations. More specifically, the four panels refer to the four different relations used to estimate the expected radio luminosities presented in Sect. 3.2. Similarly, in Appenidx B and in Fig. B.1, we present the same plot but showing the observed radio luminosity upper limits directly compared to the observed quantities from which the expected radio luminosities are computed in Sect. 3.2: the broad Hα luminosity, MBH, the [O III] λ5007 luminosity and the 4400 Å luminosity.
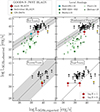 |
Fig. 3. Observed rest-frame 5GHz radio luminosity vs. expected rest-frame 5 GHz radio luminosity of different samples of high-z and local BLAGN according to the four RQ AGN relations described in Sect. 3.2. The black data points represent the JWST-detected BLAGN analyzed in this work, the red diamond is their stack, and the gold star is the BLAGN GN-28074 reported in Juodžbalis et al. (2024a). The green symbols indicate sources from different local analog samples. The green square represents the position of SBS 0355-052 (Hatano et al. 2026; Johnson et al. 2009), the thick crosses represent the metal-poor dwarf BLAGN reported in Burke et al. (2021), the thin crosses are the X-ray weak BLAGN reported in Paul et al. (2024), and the filled triangles are the radio detected and RQ NLS1 reported in Berton et al. (2018). The light blue data point in the top left panel represents the stack of the X-ray selected but radio undetected AGN on the GOODS-N field performed by Radcliffe et al. (2021). The red diamond and the black data points in the bottom right panel, are computed considering log R = 1, while the red circle indicates the expected radio luminosity assuming log R = 0. The gray shaded areas represent the scatter of the relations, while the black dashed line is the 1:1 relation. |
While in general most of the individual BLAGN have 3σ radio upper limit above the expected radio luminosities the upper limit corresponding to the stack lies below the 1:1 line in all the panels (except for the Lopt − Lradio relation in the case R = 0), even if it is still compatible with the scatter of the relations. In some cases also the individual upper limits lie significantly below the 1:1 lines. Most remarkably, GN-28074 (the so called ‘Rosetta stone’ presented in Juodžbalis et al. 2024a), shows a radio upper limit significantly below its expected radio luminosity, with a deviation of ∼1 dex in all panels, much larger than the scatters of the relations.
For comparison, in the two upper panels of Fig. 3, we also show the positions of various local AGN, whose physical properties (in terms of metallicities, X-ray deficit, host galaxy properties or SMBH mass) are similar to the ones of the high-z AGN discovered by the JWST and studied in this work (see Sect. 2.1). These sources (green markers) are as detailed below:
-
SBS 0335-052 (green square) is a low metallicity (∼1/40 Z⊙) dwarf galaxy, initially thought to be a pure star-forming galaxy (SFG), that was recently found to host an AGN, based on the detection of broad Hα emission lines, high ionization lines, and mid-IR variability (Hatano et al. 2026, 2024). Despite these features, it remains undetected in X-ray, with only a weak signal attributed to its host galaxy. Its X-ray weakness is as extreme as the one measured for GN-28074 (Juodžbalis et al. 2024a).
-
Four spectroscopically selected BLAGN from the SDSS, that are hosted in metal-poor dwarf galaxies (Burke et al. 2021; thick green crosses). Like the sources investigated in this work, these AGN are metal poor and all undetected in X-ray and show X-ray luminosity upper limits that are 1-2 dex lower than expected, assuming they are standard BLAGN.
-
The X-ray weak local AGN studied in the radio band by Paul et al. (2024, green crosses). These AGN exhibit significant X-ray weakness, based on their X-ray-to-UV luminosity ratio, but do not show significant obscuration from their X-ray spectral analysis (log NH < 22). These sources are also generally characterized by high accretion rates (λedd > 0.1).
-
the 23 radio-detected NLS1 galaxies (green triangles) presented by Berton et al. (2018). NLS1 are a class of AGN with broad permitted lines, which are narrower than in standard BLAGN (but still broader than the forbidden lines), implying SMBH with masses 105 − 108 M⊙. In addition, they are often characterized by high accretion rates, approaching the Eddington limit. NLS1 show steep X-ray spectra (with photon indices that can approach Γ ∼ 3 (compared to the usual value of Γ ∼ 1.9; Vaughan et al. 1999), resulting in a natural X-ray weakness in the harder part of the X-ray spectrum. The analogy with NLS1 has been suggested by Maiolino et al. (2025) as one of the possible (but not exhaustive) solutions to address the origin of the X-ray weakness of the high-z JWST-selected BLAGN.
For all these local analogs we took publicly available rest frame L5GHz, and when the radio luminosity was provided at a different rest frame frequency we converted it into rest frame L5GHz using the observed radio spectral index or α = −0.5 when the spectral index was not available (the same α assumed for our BLAGN analysis).
Most of the aforementioned local analogs show radio luminosities (or radio upper limits) that are 0.5–1.5 dex lower than their expected values, based on the considered scaling relations, suggesting that the observed X-ray weakness may be associated with an observed radio weakness. The physical properties of these local sources (including the X-ray weakness) are similar to those of the JWST detected BLAGN, suggesting that also the latter might show a radio-weak behavior.
In the first panel of Fig. 3 we also plot the position of the radio stack performed by Radcliffe et al. (2021) obtained from 88 X-ray detected AGN in the GOODS-N field that are undetected in the deep 1.5 GHz e-MERGE radio image. The radio stack returned a clear detection (S/N ∼ 10). Interestingly, the stacked radio luminosity of these AGN nicely falls on the D’Amato et al. (2022) relation, suggesting this population might be dominated by standard RQ AGN. Contrarily, the JWST-selected BLAGN investigated in this work are not detected in X-rays (showing a significant X-ray weakness), and are not detected in the radio stack, suggesting that they probably constitute a different population of AGN compared to the sources analyzed in Radcliffe et al. (2021).
4. Discussion
4.1. Radio emission from star formation
The observed radio emission of the JWST-selected BLAGN might not only be determined by their AGN contribution but also by the contribution of SF. The star formation rates (SFRs) of the sources investigated in this work are highly uncertain due to the difficulties in decomposing the AGN from the host-galaxy emission via SED fitting. To provide an estimate of the amount of radio emission produced by SF in these sources, we proceeded as follows. We took the available stellar mass (for sources from Maiolino et al. 2024a; Juodžbalis et al. 2024a,b, 2025), and we considered as a reference value for the other sources the average stellar mass of the sample, that is log M* = 8.36 M⊙. Then, we computed for each source the main-sequence (MS) SFR using the relation from Popesso et al. (2023) and finally, using Novak et al. (2017), the expected SF-related radio emission. In Fig. 4 we show for each of the sources studied in this work the fractional contribution of AGN and SF to the total radio emission (normalized to the observed radio luminosity upper limit). In particular, the AGN-related radio emission corresponds to the median value of the different expected AGN radio luminosities computed in Sect. 3.2. For the vast majority of the sources L5GHz, AGN is much larger (10–100 times) than L5GHz, SFRMS, and the contribution of SF to the global radio luminosity is negligible. However, there are also a few cases where the two contributions are comparable and where the sum of the AGN and SF radio emission crosses the threshold set by the observed radio luminosity upper limit. If these sources really host MS galaxies, this analysis further supports the scenario in which the AGN-related radio emission must be weaker. We discuss this point further in Sect. 4.2.
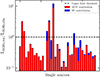 |
Fig. 4. Distribution of the total 5 GHz radio luminosities (L5GHz, AGN + L5GHz, SFRMS) of the JWST-selected BLAGN investigated in this work normalized by the 3σ 5 GHz luminosity upper limit obtained for each of these sources. For each source we show the fractional contribution to the total radio luminosity of the AGN and SF, as described in Sect. 4.1. The sources crossing the black dashed line (L5GHz, tot = L5GHz, obs) are those in tension with the radio nondetection. |
Some works also investigated alternative scenarios to the AGN one to explain the origin of the broad emission component, invoking for example dense star formation and outflows (Kokubo & Harikane 2024). Therefore, we computed the expected radio emission in the extreme hypothesis that the whole Hα luminosity (broad+narrow) of these sources is due to SF. In particular, we used the relation reported in Reddy et al. (2022), derived from BPASS population synthesis models with metallicity Z = 0.001 (i.e., ∼0.07 the solar metallicity, which is close to what typically inferred for these galaxies), including the effects of stellar binaries, and assuming an upper-mass initial mass function (IMF) cutoff of 100 M⊙. In Fig. 5 we show the ratio between the SFR derived from the radio upper limits and the one obtained from the total Hα luminosities. For most of the sources, the SFR derived from Hα is not constraining to completely rule out scenarios alternative to AGN to explain the nature of the broad Hα emission. However, there is one source, GN-28074, for which the upper limits are incompatible with the Hα emission being due to SF (because SFRdata/SFRHα < 1), while for other two BLAGN we have SFRdata/SFRHα < 2 (and so they are close to being incompatible with Hα due to SF). Using the relation of Kennicutt & Evans (2012) to derive the SFR from the Hα luminosity, we obtained SFRHα 0.4 dex larger than those determined using Reddy et al. (2022), moving points downwards in Fig. 5. This is a further indication towards an AGN origin of the Hα emission.
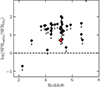 |
Fig. 5. Ratio of the SFR derived from the radio luminosity upper limits to the SFR derived assuming the whole Hα emission (narrow+broad) is due to SF. The red data point corresponds to the value of the stack. The black dashed line traces the threshold below which the SFRHα becomes incompatible with the radio nondetection. |
4.2. Radio-quiet AGN scenario
Most of the JWST-detected BLAGN show radio upper limits that are compatible with the expected RQ AGN luminosity predicted by the relations. The position of the stack in the four panels of Fig. 3 is consistent with the uncertainties and scatter of the four relations, but is generally placed below the 1:1 relation, possibly suggesting that these sources could be weaker than what expected from the standard AGN relations. In each panel, there is a group of sources, in particular GN-28074, whose upper limits are well below their expected luminosities. Given that the physical properties and the spectroscopic selection of these anomalously radio-weak BLAGN do not differ from the other sources investigated in this work, apart from the lower redshift or the larger LHα, and therefore Lbol), we might expect all these sources to have similar radio properties.
As we discussed in Sect. 4.1, the observed radio emission from these sources is not necessarily determined only by the AGN but also by the contribution of SF. On average, the AGN-driven radio luminosity is dominant over the SF one, yet this makes the observed radio upper limits conservative, given that the expected L5 GHz (x-axis in Fig. 3) refers only to the AGN-related component, and therefore we should subtract the SF radio contribution to the observed L5 GHz (y-axis).
Furthermore, the points in Fig. 3 would move to the bottom right if a flatter spectral index is assumed (α = 0, as typically seen in RQ AGN cores Chen et al. 2023; Alhosani et al. 2022), as shown in Appendix C. This would result in tighter radio weakness constraints.
To further check the anomalous behaviour of our sources, we looked for non-JWST-selected BLAGN on the GOODS-N field falling on the same radio images considered in this work. In particular, we look at the type 1 AGN selection performed by Coil et al. (2015) among the spectra of the MOSFIRE Deep Evolution Field (MOSDEF) survey. They identified 5 BLAGN at z ∼ 2.5 on GOODS-N, 4 of them are X-ray detected, while the undetected one has log L2−10 keV < 42.88. Given the well-established L2−10 keV-to-bolometric luminosity relation (Duras et al. 2020), these sources have log Lbol ∼ 44 − 45, comparable to those of our sources. However, in contrast with our findings, all these sources are radio-detected in at least one of the GOODS-N radio maps explored in this work. Additionally, the X-ray and radio luminosities of these sources perfectly align with the expectations from the L2−10 keV − Lradio relation of D’Amato et al. (2022), as presented in Appendix D.
Additionally, the radio (but also the X-ray) luminosity upper limits of the BLAGN investigated in this work are, in principle, compatible with the range of luminosities sampled by local RQ Low-Luminosity AGN (LLAGN; Panessa & Giroletti 2013; Baldi et al. 2021). However, most of the latter do not show broad Balmer emission lines, with some works suggesting that the BLR might disappear in these objects (Nicastro 2000; Laor 2003). Furthermore, the [O III] or Hα luminosities of the JWST-selected BLAGN are orders of magnitude larger than the corresponding values for typical broad-line LLAGN: the average LHα of our sources is ∼1 − 5 × 1042 erg s−1, while the typical range for broad-line LLAGN is LHα ∼ 1037 − 39 erg s−1 (Ho et al. 1997; Balmaverde & Capetti 2014).
Therefore, to test the hypothesis that the 37 JWST-selected BLAGN are drawn from a standard RQ AGN population and that the fact that we do not detect any of them can be simply ascribed to the scatter of the relations described in Sect. 3.2, we performed a statistical test. For each of the relations reported in Fig. 3, we generated the expected radio luminosities of the sample of 37 BLAGN and repeated this for 104 times. For each source and each of the 104 runs we randomly extract the L5 GHz,exp from a Gaussian distribution centered on the value returned by the relation and with σ equal to the scatter of the relation. For the optical to radio luminosity relations (where we assumed two distinct radio loudness parameters) we considered σ = 0.42 following Baloković et al. (2012). Then, for each relation and for each run, we checked how many times all the 37 BLAGN had L5 GHz,exp < L5 GHz,obs, i.e., they were all undetected. For the L[OIII] − Lradio relation, we considered only the 13 sources for which L[OIII] is available. The nondetection probabilities of all the BLAGN are reported in Table 3 and are found to be negligible in all cases, except for the optical relation assuming log R = 0, where the probability is ∼25%. We note that the probabilities reported in Table 3 for the LX − Lrad and FP relations, were computed by summing in quadrature the intrinsic scatter of the relations and the scatter of the relation used to compute the expected X-ray luminosity (Jin et al. 2012).
In conclusion, the statistical test reported above suggests that the radio nondetection of all these uniformly selected sources is difficult to explain only in terms of the scatter of the RQ AGN relations. Therefore, even if the RQ AGN nature cannot be completely ruled out, in the following sections we investigate possible scenarios that could produce a radio weakness in these peculiar sources.
4.3. Free-free absorption
Radio emission is generally largely unaffected by obscuration and can be observed even from the most obscured environments, contrary to the X-rays that are almost completely absorbed at CTK hydrogen column densities (Mazzolari et al. 2024). However, also radio emission, especially at low frequency, can be absorbed in particular conditions as a consequence of radio free-free absorption due to the presence of a large density of free electrons (O’Dea 1998; Baskin & Laor 2021). One possibility (discussed in Maiolino et al. 2025) to justify the extreme X-ray weakness of these sources, is that the X-ray photons are absorbed by a distribution of clouds with CTK column densities and a very low dust content, such as the broad-line region (BLR) clouds. Even so, the additional requirement is that their covering factor should be fairly high (close to 4π) if they are invoked to account for the large fraction of X-ray weak AGN discovered by the JWST. The question arises of whether these BLR clouds can also be so thick (and with enough free electrons) to also absorb the radio emission.
The free-free opacity τff is given by
 (1)
(1)
where Te is the medium electron temperature, νrest is the rest frame frequency of the radio emission (i.e., νrest = (1 + z)νobs), and EM is the emission measure, which is defined as the integral of the square of the free electrons density ne2 along the line of sight. The EM can be easily expressed in terms of the fi2NH2 column of free electrons (or, equivalently, the column of ionized hydrogen), in the form of Ne2r−1 where r the thickness of the ionized medium along the line of sight. Therefore, the expression of τff becomes
 (2)
(2)
in the source rest frame. The BLR clouds usually have a temperature in the range 5000 − 25 000 K (Peterson 1997). Following the computation in Netzer (2013), typical column densities of ionized gas in AGN BLR are of the order of 1−5 × 1022 cm−2. As another example, Ferland et al. (2009) found for the local AGN Akn120 an ionized column density of ∼ 5 × 1021 cm−2. The estimated thicknesses of the ionized component of the BLR clouds is generally very small. Peterson (1997), simply requiring photoionization equilibrium of the clouds, derived r ∼ 10−6 that can become r ∼ 10−3 if the whole BLR is ionized. Therefore, even conservatively assuming Ne ∼ 5 × 1021 cm−2, we get τff > 300 − 3 × 10⁵ at νobs = 1.5 GHz, implying large obscuration. We note that the possibility of radio free-free absorption had already been pointed out for the ‘Rosetta Stone’ (GN-28074; Juodžbalis et al. 2024a).
The effect of free-free absorption on the radio emission spectrum is to progressively flatten the low-frequency part and eventually even produce an inverted radio spectrum on that side. Interestingly, this radio spectral shape, with a significant flattening at ν < 1.4 GHz was observed in SBS 0355-052 (Johnson et al. 2009); the local radio weak dwarf AGN reported in Fig. 3.
However, free-free absorption would imply that the whole (or at least most of the) radio emission is confined within scales that are smaller or comparable to those of the absorbing medium. If the absorbing medium is made of BLR gas clouds, then we have to check whether the radio emission is produced on larger or smaller scales than those of the BLR. To estimate the radi of the BLR for our sources we used the scaling relation between the BLR radius and AGN luminosity derived in GRAVITY Collaboration (2024) using Near-infrared interferometry. Based on this relation, the median BLR size in our sample is ∼0.03 pc and ranges 0.01 < RBLR/pc < 0.07. We then derived the minimum size of the radio-emitting region, following Laor & Behar (2008). We can make the reasonable hypothesis of an inner optically thick radio-emitting source and compute this size considering the maximum flux per unit area emitted by a synchrotron source. The presence of an inner, compact, and with flat spectral slope radio core was observed in many RQ AGN using high-resolution interferometry (Chen et al. 2023; Paul et al. 2024; Laor & Behar 2008; Alhosani et al. 2022). With the appropriate corrections for high-redshift sources, the relation derived in Laor & Behar (2008) has the form
 (3)
(3)
Here Lν,rest is the radio luminosity at rest-frame frequency νrest, and Lbol is the bolometric luminosity. Given that we are testing the radio absorption scenario, for each of the sources we assume as Lν,rest the median radio AGN luminosity obtained from the relations described in Sect. 3.2. Considering the equation above, the minimum size of the radio-emitting regions for our sources is on average comparable or lower to that of the BLR, having on average an extension R < 0.01 pc for νobs > 1.5 GHz.
Even if with the discussion above we found that the minimum scale of the radio emission can reside inside the BLR, some recent works show that the bulk of the radio emission, also in RQ AGN, can extend up to scales much larger than ∼1 pc. Chen et al. (2023), comparing high-resolution and low-resolution radio observations of a sample of 71 local RQ AGN (corresponding to physical scales of 2–20 pc and 200–2000 pc, respectively), found that the average radio luminosity associated with the compact core is one order of magnitude lower than the one associated with the extended scale radio emission, suggesting that only ∼10% of the radio emission of these sources in confined in their innermost regions. They also found that for most objects, the compact cores show flatter spectral indices (α > −0.5) compared to the extended radio emission.
Therefore, one might wonder if free-free absorption can also happen at larger scales, for example up to the torus scale. We have now to apply Eq. (2) to the typical AGN torus conditions. Typical torus temperatures are of the order of Te ∼ 103 K, and it can be considered made by two distinct components, a molecular zone and an atomic zone. In the first, the amount of free electrons is completely negligible (Risaliti et al. 2003). For the atomic zone, the lower temperatures and pressures of the torus compared to the BLR (together with the fact that most of the ionizing radiation might be absorbed at the BLR scale) cause the fraction of ionized hydrogen to be lower, therefore suppressing τff in Eq. (2). Therefore, if free-free absorption is at the origin of a radio weakness in our sources, it likely happen on scales that are comparable to those of the BLR, or its vicinity, providing an upper limit also to the extension of the radio emission. It is worth noting that for GN-28074, based on photoionization calculations, Juodžbalis et al. (2024a) estimate a location of the absorbing medium that is outside the typical BLR radius (though still within the inner side of the torus as defined by the dust sublimation radius), suggesting that the absorber is actually dense gas located in the outer regions of the BLR, although still confined within a very compact zone.
Another possible scenario to explain the possible radio weakness of our sources is Synchrotron self-absorption (SSA). However, it is hard to test with the data in our hand and is only briefly discussed in Appendix E.
4.4. Lack (or disruption) of the magnetic field and X-ray corona
A magnetic field is essential to observe AGN radio emission since synchrotron emission relies on electrons accelerated by this field and interacting with it. The X-ray corona, producing most of the SMBH’s X-ray emission, is also linked to magnetic processes (Jafari 2019; Merloni et al. 2003; Merloni & Fabian 2002). The corona is thought to be a magnetically powered plasma, with magnetic energy heating and sustaining electrons near the SMBH. Therefore, the presence of the nuclear magnetic field, or lack thereof, can link the strength of X-ray and radio emission.
The origin of the magnetic field close to an SMBH is generally ascribed to magneto-rotational instabilities in the SMBH accretion disk, which produce a seed magnetic field that is then amplified and transported vertically due to different possible mechanisms, such as buoyancy (Merloni & Fabian 2002; Miller & Stone 2000). Following the description provided in Di Matteo (1998), magnetic field amplification as a consequence of buoyancy can lead to the formation of an accretion-disk corona consisting of many magnetic loops where the magnetic field intensity is set by the condition
 (4)
(4)
where ndisk is the gas number density in the disk and Tdisk the disk temperature. Then, magnetic reconnection episodes can release a significant amount of energy and heat this region up to usual X-ray emitting temperatures. Taking the equation for the maximum disk temperature reported in Bonning et al. (2007) for a Schwarzschild SMBH, and assuming ndisk ∼ 1016 cm−3, we found an average value of Bcorona ∼ 2 × 10³ G for the BLAGN investigated in this work. The estimated coronal magnetic field is consistent within a factor of a few with the equipartition magnetic field derived in the assumption of optically thick radio emission,
 (5)
(5)
when rescaled to the size of the X-ray corona (R ∼ 10Rg). This may support the link between the coronal magnetic field and the one giving origin to the radio emission, if standard conditions are present.
In principle, if the magnetic field strength or its pattern are significantly altered, the magnetic heating of the corona and the production of synchrotron emission in the innermost AGN region can both cease, determining a simultaneous suppression of the radio and the X-ray emissions. Similarly, in the hypothesis of a coronal-related origin of the synchrotron emission (Laor & Behar 2008; Panessa et al. 2019), the lack (or a significant cooling) of the electrons constituting the X-ray corona can determine a similar fate.
With the data in our hands it is not possible to verify this scenario, and a proper treatment of the magnetic properties of these objects is well beyond the scope of this paper. In the following, we limit the discussion to the comparison of the properties of our sources with scenarios that have been recently discussed in the literature.
One scenario that can induce the above mentioned effects can be a much lower inner disk or coronal plasma temperature. This can happen, for example, as a consequence of a phase of super-Eddington accretion that can empty the innermost (and hotter) region of the accretion disk and generate a cooling of the electron plasma, possibly leading to the weakening of the magnetic field or of the X-ray corona (Lupi et al. 2024; Madau & Haardt 2024). The mildly super-Eddington scenario was proposed by Pacucci & Narayan (2024) to explain the widespread population of X-ray weak AGN identified by the JWST. The authors used general relativistic radiation magnetohydrodynamics (GRRMHD) simulations to investigate the origin of the JWST-selected BLAGN X-ray weakness, concluding that episodes of super-Eddington accretion can cause the inner part of the accretion disk to thicken, effectively shielding the most energetic photons, thus leading to a reduced X-ray output. They also observed that X-ray weak sources differ from typical X-ray AGN primarily in the temperature of the inner accretion disk and in disk jet production, with X-ray weak sources exhibiting lower disk temperatures and producing less energetic jets. Madau & Haardt (2024), investigating the same topic assumed a two-phase disk/corona scenario and super-Eddington accretion, finding that the X-ray corona can be embedded in a funneled geometry, where soft photons can produce a significant cooling of the coronal plasma down to much lower temperatures than for standard accretion rates, i.e., kTe ≲ 30 eV. This consequently produces an extremely soft X-ray spectrum, and therefore an intrinsic X-ray weakness. This cooling of the coronal electron plasma can significantly impact also the efficiency of synchrotron emission at comparable scales, possibly affecting the radio emission also at the larger scales probed by our frequencies (the minimum radius of the radio emitting region is at least 100 times larger than the X-ray corona).
A super-Edditgnton origin of the X-ray weakness was also suggested by Paul et al. (2024) for the X-ray weak sources shown in Fig. 3, and some of them are also radio weak. NLS1 are generally characterized by high-accretion rates and high X-ray to bolometric corrections (Vasudevan & Fabian 2007), and some of these are indeed observed to be radio weak (see Sect. 3.3). However, the NLS1 scenario alone appears not sufficient to justify some of the X-ray weakest JWST-detected BLAGN (Maiolino et al. 2025) and it is not possible to attribute to NLS1 a uniform radio emission behavior as shown by Berton et al. (2016, 2018).
In Arcodia et al. (2024), the authors investigated the possible lack of an X-ray corona in a sample of UV-optical-IR variability-selected SMBH in dwarf galaxies observed by eROSITA. These sources show a significant observed X-ray weakness compared to their optical luminosity, and most of them are also radio weak with respect to the Merloni et al. (2003) FP relation, further suggesting that SMBH in dwarf galaxies can be much less efficient in sustaining a magnetically powered corona.
5. Conclusions
We analyzed the radio emission from a sample of 37 JWST-selected broad-line AGN residing in the GOODS-N field considering a wide set of radio images at multiple frequencies (144 MHz, 1.5 GHz, 3 GHz, 5.5 GHz, 10 GHz). Our findings are summarized in the following:
-
None of the 37 BLAGN has a counterpart in any of the radio images covering the GOODS-N field. Even the radio stacking analysis did not show any indication of radio emission. We then used, as a reference, the radio upper limits for the single sources and for the stack obtained from the 3 GHz image, which provides the deepest constraints. In particular, the 3σ upper limit from the stack corresponds to a rest frame 5 GHz radio luminosity log L5 GHz (erg s−1) = 39.4.
-
The upper limits in the observed radio luminosity were compared with the expected radio luminosities for RQ AGN derived by using a set of different relations, including L[OIII] − Lradio, LX − Lradio, Loptical − Lradio, and FP relations. This comparison shows that most of the individual BLAGN, as well as their stack, are compatible with being RQ AGN, considering the scatter of the relations. However, this comparison also showed that some of these sources significantly deviate from the expected 1:1 relation, potentially suggesting a weaker radio emission.
-
We investigated the SF contribution to the radio emission of these objects, and found that for most of them the SF-driven radio emission is generally subdominant compared to the expected RQ AGN radio emission, but yet nonnegligible for some sources. This makes these BLAGN observed radio luminosity upper limits even more stringent, given that we should take into account only the AGN-related radio emission component in Fig. 3. Moreover, we computed the SFR assuming the case in which the whole Hα emission (broad + narrow) is caused by SF, and we found that for a few sources this is incompatible with the radio nondetection. This further supports the AGN origin (BLR) of the broad Hα in these sources.
-
We performed a statistical test to check the hypothesis that not detecting any of the 37 investigated sources is still statistically consistent with the RQ AGN scenario and can be simply ascribed to the scatter of the relations considered. The test revealed probabilities P ∼ 10−4 for all the relations except for one, suggesting that these BLAGN may instead be characterized by a radio weakness (in addition to the observed X-ray weakness). Additionally, non-JWST-selected BLAGN on the GOODS-N field (Coil et al. 2015) are clearly detected in the radio images considered in this work, while our objects are not. Therefore, we discussed possible scenarios that can produce a radio weakness.
-
A Compton-thick and almost spherical distribution of the BLR clouds has been proposed as a possible cause of the observed X-ray weakness of these sources. We investigate the possibility that this distribution can also entail free-free absorption of the radio emission. We find that free-free absorption is possible provided that most of the radio emission is confined inside the scale of the BLR or its vicinity (i.e., on scales smaller than the sublimation radius).
-
We also argue that the lack or disruption of the inner magnetic field and hot corona, possibly associated with super-Eddington accretion, can simultaneously explain an intrinsic radio weakness and an intrinsic X-ray weakness.
The analysis performed in this work shows that to definitively probe the nature, the origin, and possibly the weakness and/or lack of radio emission of these sources, deeper radio images are needed. In particular, having radio images one order of magnitude deeper than those provided by the current facilities will allow us to set more stringent constraints on the radio properties of JWST-selected X-ray weak AGN. Subarcsec resolution will also be critical to ensure that contamination from galaxy-scale radio emission is low. In this sense, the deep radio continuum observations that will be performed by the SKAO will play an important role given that they are expected to reach an rms of 0.05 (0.04)μJy at 0.5 (0.1) arcsec resolution in the UD surveys at frequencies of ∼1 (10) GHz (Prandoni & Seymour 2015).
Acknowledgments
GM acknowledges useful conversations and discussions with A. Laor, C. Spingola, G. Cresci, A. Trinca. We acknowledge support from the Bando Ricerca Fondamentale INAF 2022 and 2023. ID acknowledges funding by the European Union – NextGenerationEU, RRF M4C2 1.1, Project 2022JZJBHM: “AGN-sCAN: zooming-in on the AGN-galaxy connection since the cosmic noon” – CUP C53D23001120006. E.F.-J.A. acknowledge support from UNAM-PAPIIT project IA102023, and from CONAHCyT Ciencia de Frontera project ID: CF-2023-I-506. The National Radio Astronomy Observatory is a facility of the National Science Foundation operated under cooperative agreement by Associated Universities, Inc. RM, XJ, FD, JS and IJ acknowledge support by the Science and Technology Facilities Council (STFC), by the ERC through Advanced Grant 695671 “QUENCH”, and by the UKRI Frontier Research grant RISEandFALL. RM also acknowledges funding from a research professorship from the Royal Society. MS acknowledges financial support from the Italian Ministry for University and Research, through the grant PNRR-M4C2-I1.1-PRIN 2022-PE9-SEAWIND: Super-Eddington Accretion: Wind, INflow and Disk-F53D23001250006-NextGenerationEU. IP acknowledges support from INAF under the Large Grant 2022 funding scheme (project “MeerKAT and LOFAR Team up: a Unique Radio Window on Galaxy/AGN co-Evolution”)”. HÜ acknowledges support through the ERC Starting Grant 101164796 “APEX”.
References
- Akins, H. B., Casey, C. M., Lambrides, E., et al. 2025, ApJ, 991, 37 [Google Scholar]
- Alhosani, A., Gelfand, J. D., Zaw, I., et al. 2022, ApJ, 936, 73 [NASA ADS] [CrossRef] [Google Scholar]
- Ananna, T. T., Bogdán, Á., Kovács, O. E., Natarajan, P., & Hickox, R. C. 2024, ApJ, 969, L18 [NASA ADS] [CrossRef] [Google Scholar]
- Arcodia, R., Merloni, A., Comparat, J., et al. 2024, A&A, 681, A97 [NASA ADS] [CrossRef] [EDP Sciences] [Google Scholar]
- Arnaudova, M. I., Smith, D. J. B., Hardcastle, M. J., et al. 2024, MNRAS, 528, 4547 [NASA ADS] [CrossRef] [Google Scholar]
- Baldi, R. D., Rodríguez Zaurín, J., Chiaberge, M., et al. 2019, ApJ, 870, 53 [CrossRef] [Google Scholar]
- Baldi, R. D., Williams, D. R. A., Beswick, R. J., et al. 2021, MNRAS, 508, 2019 [NASA ADS] [CrossRef] [Google Scholar]
- Balmaverde, B., & Capetti, A. 2014, A&A, 563, A119 [NASA ADS] [CrossRef] [EDP Sciences] [Google Scholar]
- Baloković, M., Smolčić, V., Ivezić, Ž., et al. 2012, ApJ, 759, 30 [CrossRef] [Google Scholar]
- Bariuan, L. G. C., Snios, B., Sobolewska, M., Siemiginowska, A., & Schwartz, D. A. 2022, MNRAS, 513, 4673 [NASA ADS] [CrossRef] [Google Scholar]
- Baskin, A., & Laor, A. 2021, MNRAS, 508, 680 [NASA ADS] [CrossRef] [Google Scholar]
- Berton, M., Caccianiga, A., Foschini, L., et al. 2016, A&A, 591, A98 [NASA ADS] [CrossRef] [EDP Sciences] [Google Scholar]
- Berton, M., Congiu, E., Järvelä, E., et al. 2018, A&A, 614, A87 [NASA ADS] [CrossRef] [EDP Sciences] [Google Scholar]
- Bonning, E. W., Cheng, L., Shields, G. A., Salviander, S., & Gebhardt, K. 2007, ApJ, 659, 211 [NASA ADS] [CrossRef] [Google Scholar]
- Bonzini, M., Padovani, P., Mainieri, V., et al. 2013, MNRAS, 436, 3759 [Google Scholar]
- Burke, C. J., Liu, X., Chen, Y.-C., Shen, Y., & Guo, H. 2021, MNRAS, 504, 543 [NASA ADS] [CrossRef] [Google Scholar]
- Casey, C. M., Kartaltepe, J. S., Drakos, N. E., et al. 2023, ApJ, 954, 31 [NASA ADS] [CrossRef] [Google Scholar]
- Chen, S., Laor, A., Behar, E., Baldi, R. D., & Gelfand, J. D. 2023, MNRAS, 525, 164 [Google Scholar]
- Cirasuolo, M., Celotti, A., Magliocchetti, M., & Danese, L. 2003, MNRAS, 346, 447 [NASA ADS] [CrossRef] [Google Scholar]
- Coil, A. L., Aird, J., Reddy, N., et al. 2015, ApJ, 801, 35 [Google Scholar]
- D’Amato, Q., Prandoni, I., Gilli, R., et al. 2022, A&A, 668, A133 [NASA ADS] [CrossRef] [EDP Sciences] [Google Scholar]
- de Vries, W. H., Hodge, J. A., Becker, R. H., White, R. L., & Helfand, D. J. 2007, AJ, 134, 457 [Google Scholar]
- Delvecchio, I., Smolčić, V., Zamorani, G., et al. 2017, A&A, 602, A3 [NASA ADS] [CrossRef] [EDP Sciences] [Google Scholar]
- Di Matteo, T. 1998, MNRAS, 299, L15 [NASA ADS] [CrossRef] [Google Scholar]
- Duras, F., Bongiorno, A., Ricci, F., et al. 2020, A&A, 636, A73 [NASA ADS] [CrossRef] [EDP Sciences] [Google Scholar]
- Fan, X.-L., & Bai, J.-M. 2016, ApJ, 818, 185 [NASA ADS] [CrossRef] [Google Scholar]
- Ferland, G. J., Hu, C., Wang, J.-M., et al. 2009, ApJ, 707, L82 [Google Scholar]
- Finkelstein, S. L., Bagley, M. B., Arrabal Haro, P., et al. 2022, ApJ, 940, L55 [NASA ADS] [CrossRef] [Google Scholar]
- GRAVITY Collaboration (Amorim, A., et al.) 2024, A&A, 684, A167 [NASA ADS] [CrossRef] [EDP Sciences] [Google Scholar]
- Guidetti, D., Bondi, M., Prandoni, I., et al. 2017, MNRAS, 471, 210 [Google Scholar]
- Hainline, K. N., Maiolino, R., Juodžbalis, I., et al. 2025, ApJ, 979, 138 [Google Scholar]
- Harikane, Y., Zhang, Y., Nakajima, K., et al. 2023, ApJ, 959, 39 [NASA ADS] [CrossRef] [Google Scholar]
- Hatano, S., Kokubo, M., Ouchi, M., et al. 2026, ApJ, 997, 241 [Google Scholar]
- Hatano, S., Ouchi, M., Umeda, H., et al. 2024, ApJ, 966, 170 [Google Scholar]
- Ho, L. C., Filippenko, A. V., Sargent, W. L. W., & Peng, C. Y. 1997, ApJS, 112, 391 [NASA ADS] [CrossRef] [Google Scholar]
- Inayoshi, K., & Maiolino, R. 2025, ApJ, 980, L27 [Google Scholar]
- Ivison, R. J., Chapman, S. C., Faber, S. M., et al. 2007, ApJ, 660, L77 [NASA ADS] [CrossRef] [Google Scholar]
- Jafari, A. 2019, arXiv e-prints [arXiv:1904.09677] [Google Scholar]
- Jiménez-Andrade, E. F., Murphy, E. J., Momjian, E., et al. 2024, ApJ, 972, 89 [CrossRef] [Google Scholar]
- Jin, C., Ward, M., & Done, C. 2012, MNRAS, 422, 3268 [Google Scholar]
- Johnson, K. E., Hunt, L. K., & Reines, A. E. 2009, AJ, 137, 3788 [NASA ADS] [CrossRef] [Google Scholar]
- Juodžbalis, I., Ji, X., Maiolino, R., et al. 2024a, MNRAS, 535, 853 [CrossRef] [Google Scholar]
- Juodžbalis, I., Maiolino, R., Baker, W. M., et al. 2024b, Nature, 636, 594 [CrossRef] [Google Scholar]
- Juodžbalis, I., Maiolino, R., Baker, W. M., et al. 2025, arXiv e-prints [arXiv:2504.03551] [Google Scholar]
- Kellermann, K. I., Sramek, R., Schmidt, M., Shaffer, D. B., & Green, R. 1989, AJ, 98, 1195 [Google Scholar]
- Kennicutt, R. C., & Evans, N. J. 2012, ARA&A, 50, 531 [NASA ADS] [CrossRef] [Google Scholar]
- King, A. 2025, MNRAS, 536, L1 [Google Scholar]
- Kocevski, D. D., Onoue, M., Inayoshi, K., et al. 2023, ApJ, 954, L4 [NASA ADS] [CrossRef] [Google Scholar]
- Kocevski, D. D., Finkelstein, S. L., Barro, G., et al. 2025, ApJ, 986, 126 [Google Scholar]
- Kokubo, M., & Harikane, Y. 2024, ApJ, submitted, [arXiv:2407.04777] [Google Scholar]
- Lambrides, E., Garofali, K., Larson, R., et al. 2024, submitted, [arXiv:2409.13047] [Google Scholar]
- Laor, A. 2003, ApJ, 590, 86 [NASA ADS] [CrossRef] [Google Scholar]
- Laor, A., & Behar, E. 2008, MNRAS, 390, 847 [NASA ADS] [CrossRef] [Google Scholar]
- Liu, T., Tozzi, P., Wang, J.-X., et al. 2017, ApJS, 232, 8 [NASA ADS] [CrossRef] [Google Scholar]
- Liu, Y., Wang, R., Momjian, E., et al. 2021, ApJ, 908, 124 [Google Scholar]
- Lupi, A., Quadri, G., Volonteri, M., Colpi, M., & Regan, J. A. 2024, A&A, 686, A256 [NASA ADS] [CrossRef] [EDP Sciences] [Google Scholar]
- Madau, P., & Haardt, F. 2024, ApJ, 976, L24 [Google Scholar]
- Maiolino, R., Scholtz, J., Curtis-Lake, E., et al. 2024a, A&A, 691, A145 [NASA ADS] [CrossRef] [EDP Sciences] [Google Scholar]
- Maiolino, R., Scholtz, J., Witstok, J., et al. 2024b, Nature, 627, 59 [NASA ADS] [CrossRef] [Google Scholar]
- Maiolino, R., Risaliti, G., Signorini, M., et al. 2025, MNRAS, 538, 1921 [Google Scholar]
- Matthee, J., Naidu, R. P., Brammer, G., et al. 2024, ApJ, 963, 129 [NASA ADS] [CrossRef] [Google Scholar]
- Mazzolari, G., Gilli, R., Brusa, M., et al. 2024, A&A, 687, A120 [NASA ADS] [CrossRef] [EDP Sciences] [Google Scholar]
- Mazzolari, G., Scholtz, J., Maiolino, R., et al. 2025, A&A, 700, A12 [NASA ADS] [CrossRef] [EDP Sciences] [Google Scholar]
- Merloni, A., & Fabian, A. C. 2002, MNRAS, 332, 165 [NASA ADS] [CrossRef] [Google Scholar]
- Merloni, A., Heinz, S., & di Matteo, T. 2003, MNRAS, 345, 1057 [Google Scholar]
- Miller, K. A., & Stone, J. M. 2000, ApJ, 534, 398 [NASA ADS] [CrossRef] [Google Scholar]
- Muxlow, T. W. B., Thomson, A. P., Radcliffe, J. F., et al. 2020, MNRAS, 495, 1188 [Google Scholar]
- Netzer, H. 2013, The Physics and Evolution of Active Galactic Nuclei (Cambridge, UK: Cambridge University Press) [Google Scholar]
- Nicastro, F. 2000, ApJ, 530, L65 [NASA ADS] [CrossRef] [Google Scholar]
- Novak, M., Smolčić, V., Delhaize, J., et al. 2017, A&A, 602, A5 [NASA ADS] [CrossRef] [EDP Sciences] [Google Scholar]
- O’Dea, C. P. 1998, PASP, 110, 493 [Google Scholar]
- Orienti, M., & Dallacasa, D. 2014, MNRAS, 438, 463 [NASA ADS] [CrossRef] [Google Scholar]
- Pacucci, F., & Narayan, R. 2024, ApJ, 976, 96 [NASA ADS] [CrossRef] [Google Scholar]
- Panessa, F., & Giroletti, M. 2013, MNRAS, 432, 1138 [NASA ADS] [CrossRef] [Google Scholar]
- Panessa, F., Tarchi, A., Castangia, P., et al. 2015, MNRAS, 447, 1289 [NASA ADS] [CrossRef] [Google Scholar]
- Panessa, F., Baldi, R. D., Laor, A., et al. 2019, Nat. Astron., 3, 387 [Google Scholar]
- Paul, J. D., Plotkin, R. M., Brandt, W. N., et al. 2024, ApJ, 974, 66 [Google Scholar]
- Pérez-González, P. G., Barro, G., Annunziatella, M., et al. 2023, ApJ, 946, L16 [CrossRef] [Google Scholar]
- Perger, K., Fogasy, J., Frey, S., & Gabányi, K. É. 2025, A&A, 693, L2 [NASA ADS] [CrossRef] [EDP Sciences] [Google Scholar]
- Peterson, B. M. 1997, An Introduction to Active Galactic Nuclei (Cambridge: New York Cambridge University Press) [Google Scholar]
- Popesso, P., Concas, A., Cresci, G., et al. 2023, MNRAS, 519, 1526 [Google Scholar]
- Prandoni, I., & Seymour, N. 2015, in Advancing Astrophysics with the Square Kilometre Array (AASKA14), 67 [Google Scholar]
- Radcliffe, J. F., Barthel, P. D., Garrett, M. A., et al. 2021, A&A, 649, L9 [NASA ADS] [CrossRef] [EDP Sciences] [Google Scholar]
- Reddy, N. A., Topping, M. W., Shapley, A. E., et al. 2022, ApJ, 926, 31 [NASA ADS] [CrossRef] [Google Scholar]
- Ricci, C., Chang, C.-S., Kawamuro, T., et al. 2023, ApJ, 952, L28 [NASA ADS] [CrossRef] [Google Scholar]
- Richards, G. T., Lacy, M., Storrie-Lombardi, L. J., et al. 2006, ApJS, 166, 470 [Google Scholar]
- Risaliti, G., Woltjer, L., & Salvati, M. 2003, A&A, 401, 895 [NASA ADS] [CrossRef] [EDP Sciences] [Google Scholar]
- Risaliti, G., Nardini, E., Salvati, M., et al. 2011, MNRAS, 410, 1027 [Google Scholar]
- Scholtz, J., Witten, C., Laporte, N., et al. 2024, A&A, 687, A283 [NASA ADS] [CrossRef] [EDP Sciences] [Google Scholar]
- Shang, Z., Brotherton, M. S., Wills, B. J., et al. 2011, ApJS, 196, 2 [Google Scholar]
- Shimwell, T. W., Hardcastle, M. J., Tasse, C., et al. 2022, A&A, 659, A1 [NASA ADS] [CrossRef] [EDP Sciences] [Google Scholar]
- Smolčić, V., Delvecchio, I., Zamorani, G., et al. 2017a, A&A, 602, A2 [NASA ADS] [CrossRef] [EDP Sciences] [Google Scholar]
- Smolčić, V., Novak, M., Bondi, M., et al. 2017b, A&A, 602, A1 [Google Scholar]
- Stern, D., Assef, R. J., Benford, D. J., et al. 2012, ApJ, 753, 30 [Google Scholar]
- Taylor, A. J., Finkelstein, S. L., Kocevski, D. D., et al. 2025, ApJ, 986, 165 [Google Scholar]
- Trefoloni, B., Ji, X., Maiolino, R., et al. 2025, A&A, 700, A203 [NASA ADS] [CrossRef] [EDP Sciences] [Google Scholar]
- Übler, H., Maiolino, R., Curtis-Lake, E., et al. 2023, A&A, 677, A145 [NASA ADS] [CrossRef] [EDP Sciences] [Google Scholar]
- Vasudevan, R. V., & Fabian, A. C. 2007, MNRAS, 381, 1235 [NASA ADS] [CrossRef] [Google Scholar]
- Vaughan, S., Reeves, J., Warwick, R., & Edelson, R. 1999, MNRAS, 309, 113 [Google Scholar]
- Wang, Y., Wang, T., Ho, L. C., Zhong, Y., & Luo, B. 2024, A&A, 689, A327 [NASA ADS] [CrossRef] [EDP Sciences] [Google Scholar]
- White, R. L., Helfand, D. J., Becker, R. H., Glikman, E., & de Vries, W. 2007, ApJ, 654, 99 [Google Scholar]
- Whittam, I. H., Jarvis, M. J., Hale, C. L., et al. 2022, MNRAS, 516, 245 [NASA ADS] [CrossRef] [Google Scholar]
- Xiao, M., Oesch, P. A., Bing, L., et al. 2025, A&A, 700, A231 [NASA ADS] [CrossRef] [EDP Sciences] [Google Scholar]
- Xu, C., Livio, M., & Baum, S. 1999, AJ, 118, 1169 [Google Scholar]
- Xue, Y. Q., Luo, B., Brandt, W. N., et al. 2016, ApJS, 224, 15 [Google Scholar]
- Yue, M., Eilers, A.-C., Ananna, T. T., et al. 2024, ApJ, 974, L26 [CrossRef] [Google Scholar]
- Zhang, J., Egami, E., Sun, F., et al. 2026, ApJ, 997, 250 [Google Scholar]
Appendix A: Discarding the RL AGN scenario
In this section we show that the radio undetection of the sources investigated in this work is largely inconsistent with their expected radio luminosities if they are assumed to be RL. In Fig. A.1, we show the deviation, expressed in number of σ (where σ is the intrinsic scatter of the relations), of the radio upper limits derived from the 3GHz radio image from the expected RL AGN radio luminosity. For every RL AGN luminosity relation the deviation of the stack is ≳2.5σ.
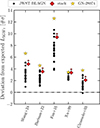 |
Fig. A.1. Deviation of the observed radio luminosity upper limits of the 37 JWST-detected BLAGN (black points) and of their stack (red diamond) compared to their expected radio luminosity according to the different RL AGN luminosity relations reported on the x-axis. The deviation is expressed in numbers of σ, where σ is the intrinsic scatter of each relation.Wang et al. (2024) and Bariuan et al. (2022) are FP relations, Fan & Bai (2016) is a direct X-ray–to–radio luminosity relation, Xu et al. (1999) is a L[OIII] − Lrad relation, while Cirasuolo et al. (2003) is a Lopt − Lrad relation. For clarity, we did not put the arrow indicating the upper limits of each of the BLAGN. |
Appendix B: Observed radio luminosity upper limits versus observable quantities
Here we show the analog of Fig. 3 but directly comparing the observed radio luminosity upper limits to the available observable quantities used to compute the expected radio luminosities in Sect. 3.2. Data points are compared directly with the scaling relations presented in Sect. 3.2.
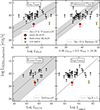 |
Fig. B.1. Similar to Fig. 3, but directly showing the observed rest-frame 5GHz radio luminosity vs. the observable quantities used to compute the expected radio luminosities in Sect. 3.2. In particular, the observed radio luminosities are compared with the broad Hα luminosities (upper left), the linear combination of broad Hα luminosity and MBH derived from the fundamental plane of Bariuan et al. (2022) (top right), the [O III] λ5007 luminosities (bottom left), and the 4400 Å luminosities (bottom right). Data points for single BLAGN (black) and for their stack (red) are compared to the scaling relations described in Sect. 3.2. In the two top panels we combined the LHα, broad vs. L2−10 keV relation from Jin et al. (2012) with the L2−10 keV vs. Lradio relation of D’Amato et al. (2022) (top left), and the fundamental plane relation of Bariuan et al. (2022) (top right). |
Appendix C: Compact radio sources with α = 0
If we assume a central compact radio-emitting source with a flat radio spectral slope, α = 0 (instead of α = −0.5 assumed in the main text), as observed for the cores of many RQ AGN (Chen et al. 2023; Alhosani et al. 2022), Fig. 3 translates into Fig. C.1, where the radio upper limits are more stringent and the deviation from the expected radio luminosity is much more significant.
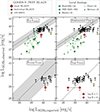 |
Fig. C.1. Same as Fig. 3, but considering α = 0 and taking the 10GHz radio image, which for α = 0 provide deeper constrains at 5GHz than the 3GHz image. |
Appendix D: Non-JWST-selected BLAGN on GOODS-N
As discussed in Sect. 4.2, we investigated the radio properties of z ∼ 2 − 3 BLAGN on the GOODS-N field identified among the MOSFIRE spectra. Here we show that, contrary to the JWST-selected BLAGN, these sources have radio luminosities perfectly consistent with the RQ AGN relation from D’Amato et al. (2022), if not even in excess.
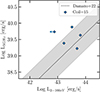 |
Fig. D.1. Radio vs. X-ray luminosity distribution of the five BLAGN presented in Coil et al. (2015). The observed radio luminosities are consistent with the prediction of the D’Amato et al. (2022) relation, except for the X-ray undetected one, which is probably radio loud. |
Appendix E: Synchrotron self-absorption
Similarly to FFA, synchrotron self-absorption (SSA) can also lead to a substantial decrease in the expected radio emission, even if the physical processes are different. When synchrothron emission is self-absorbed, the observed radio spectrum shows a turnover and a steepening below the so-called turnover (or peak) frequency νSSA, which depends on the strength of the magnetic field.
Given the undetection of the sources (and therefore the lack of information on the peak frequency, on the peak flux, and on the extension of the radio emission), we do not have the possibility to reliably test the SSA hypothesis scenario. However, using the Orienti & Dallacasa (2014) relation between SSA peak frequency and the largest linear size of the radio emission observed for a sample of compact and young radio sources, we can tentatively derive the maximum size of the radio emitting region, under the hypothesis that the peak frequency is below the frequency range explored by us (i.e., above νobs = 10 GHz). We derived for our sources maximum sizes in the range 1 − 0.1pc, i.e., consistently larger than the minimum radio-emitting region, obtained assuming the same frequency from Eq. 3, but still quite confined.
All Tables
All Figures
|
Fig. 1. 10″ × 10″ cutouts of the mean (right) and median (left) radio stacking of the 37 JWST-selected BLAGN on the GOODS-N field performed on the images presented in Sect. 2.2. The values of the rms measured in the stacked images are reported in the panels. |
| In the text | |
|
Fig. 2. Distribution of the radio 3σ upper limits obtained at the frequencies of the images described in Sect. 2.2. With empty red triangles and filled red triangles we show the sensitivities of the radio images and of the stack, respectively. The green empty circles refer to the sensitivities of the SKAO UD radio survey at ∼1 GHz and ∼10 GHz. The blue empty circle refers to the LOFAR deep radio image of the GOODS-N field. The filled blue and green circles refer to the sensitivities that would be reached considering the stack of the 37 BLAGN investigated in this work on the deep LOFAR and UD SKAO images, to be compared with the stack achieved in the currently available images. The black triangle refers to the radio stack of the eight high-z BLAGN performed in Mazzolari et al. (2025) on the AEGIS20 1.4 GHz image (Ivison et al. 2007). Instead, the gray and empty triangles refer to the radio stacks of large samples of photometrically selected LRDs performed in Perger et al. (2025) and Akins et al. (2025). |
| In the text | |
|
Fig. 3. Observed rest-frame 5GHz radio luminosity vs. expected rest-frame 5 GHz radio luminosity of different samples of high-z and local BLAGN according to the four RQ AGN relations described in Sect. 3.2. The black data points represent the JWST-detected BLAGN analyzed in this work, the red diamond is their stack, and the gold star is the BLAGN GN-28074 reported in Juodžbalis et al. (2024a). The green symbols indicate sources from different local analog samples. The green square represents the position of SBS 0355-052 (Hatano et al. 2026; Johnson et al. 2009), the thick crosses represent the metal-poor dwarf BLAGN reported in Burke et al. (2021), the thin crosses are the X-ray weak BLAGN reported in Paul et al. (2024), and the filled triangles are the radio detected and RQ NLS1 reported in Berton et al. (2018). The light blue data point in the top left panel represents the stack of the X-ray selected but radio undetected AGN on the GOODS-N field performed by Radcliffe et al. (2021). The red diamond and the black data points in the bottom right panel, are computed considering log R = 1, while the red circle indicates the expected radio luminosity assuming log R = 0. The gray shaded areas represent the scatter of the relations, while the black dashed line is the 1:1 relation. |
| In the text | |
|
Fig. 4. Distribution of the total 5 GHz radio luminosities (L5GHz, AGN + L5GHz, SFRMS) of the JWST-selected BLAGN investigated in this work normalized by the 3σ 5 GHz luminosity upper limit obtained for each of these sources. For each source we show the fractional contribution to the total radio luminosity of the AGN and SF, as described in Sect. 4.1. The sources crossing the black dashed line (L5GHz, tot = L5GHz, obs) are those in tension with the radio nondetection. |
| In the text | |
|
Fig. 5. Ratio of the SFR derived from the radio luminosity upper limits to the SFR derived assuming the whole Hα emission (narrow+broad) is due to SF. The red data point corresponds to the value of the stack. The black dashed line traces the threshold below which the SFRHα becomes incompatible with the radio nondetection. |
| In the text | |
|
Fig. A.1. Deviation of the observed radio luminosity upper limits of the 37 JWST-detected BLAGN (black points) and of their stack (red diamond) compared to their expected radio luminosity according to the different RL AGN luminosity relations reported on the x-axis. The deviation is expressed in numbers of σ, where σ is the intrinsic scatter of each relation.Wang et al. (2024) and Bariuan et al. (2022) are FP relations, Fan & Bai (2016) is a direct X-ray–to–radio luminosity relation, Xu et al. (1999) is a L[OIII] − Lrad relation, while Cirasuolo et al. (2003) is a Lopt − Lrad relation. For clarity, we did not put the arrow indicating the upper limits of each of the BLAGN. |
| In the text | |
|
Fig. B.1. Similar to Fig. 3, but directly showing the observed rest-frame 5GHz radio luminosity vs. the observable quantities used to compute the expected radio luminosities in Sect. 3.2. In particular, the observed radio luminosities are compared with the broad Hα luminosities (upper left), the linear combination of broad Hα luminosity and MBH derived from the fundamental plane of Bariuan et al. (2022) (top right), the [O III] λ5007 luminosities (bottom left), and the 4400 Å luminosities (bottom right). Data points for single BLAGN (black) and for their stack (red) are compared to the scaling relations described in Sect. 3.2. In the two top panels we combined the LHα, broad vs. L2−10 keV relation from Jin et al. (2012) with the L2−10 keV vs. Lradio relation of D’Amato et al. (2022) (top left), and the fundamental plane relation of Bariuan et al. (2022) (top right). |
| In the text | |
|
Fig. C.1. Same as Fig. 3, but considering α = 0 and taking the 10GHz radio image, which for α = 0 provide deeper constrains at 5GHz than the 3GHz image. |
| In the text | |
|
Fig. D.1. Radio vs. X-ray luminosity distribution of the five BLAGN presented in Coil et al. (2015). The observed radio luminosities are consistent with the prediction of the D’Amato et al. (2022) relation, except for the X-ray undetected one, which is probably radio loud. |
| In the text | |
Current usage metrics show cumulative count of Article Views (full-text article views including HTML views, PDF and ePub downloads, according to the available data) and Abstracts Views on Vision4Press platform.
Data correspond to usage on the plateform after 2015. The current usage metrics is available 48-96 hours after online publication and is updated daily on week days.
Initial download of the metrics may take a while.