Fig. 3.
Download original image
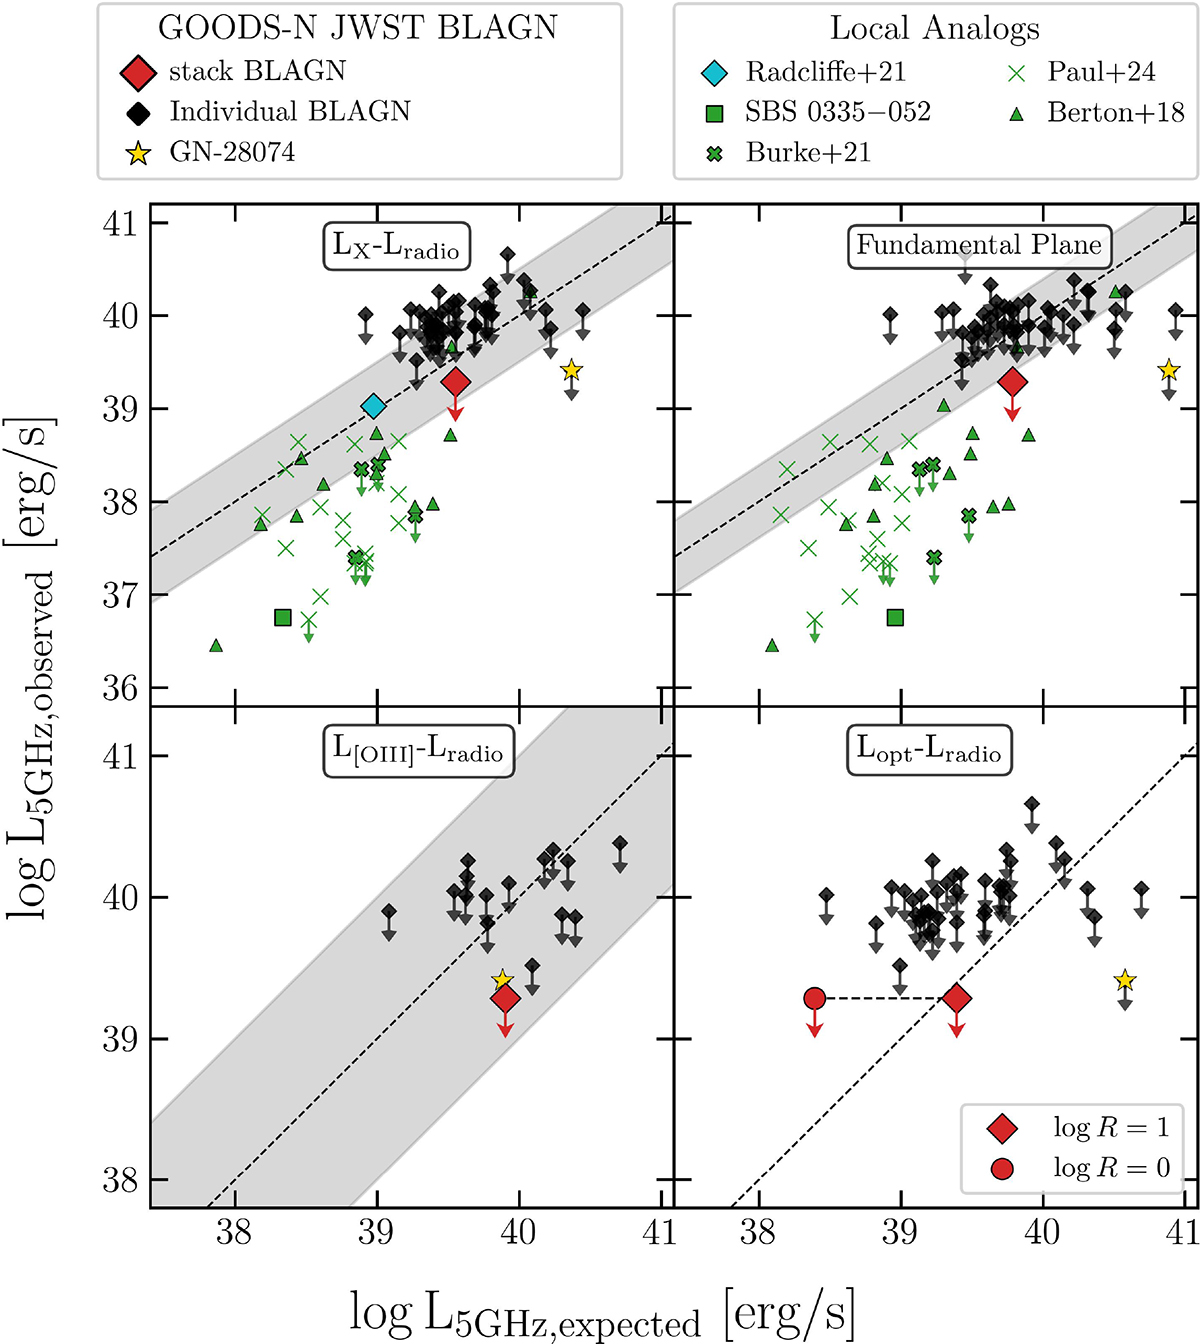
Observed rest-frame 5GHz radio luminosity vs. expected rest-frame 5 GHz radio luminosity of different samples of high-z and local BLAGN according to the four RQ AGN relations described in Sect. 3.2. The black data points represent the JWST-detected BLAGN analyzed in this work, the red diamond is their stack, and the gold star is the BLAGN GN-28074 reported in Juodžbalis et al. (2024a). The green symbols indicate sources from different local analog samples. The green square represents the position of SBS 0355-052 (Hatano et al. 2026; Johnson et al. 2009), the thick crosses represent the metal-poor dwarf BLAGN reported in Burke et al. (2021), the thin crosses are the X-ray weak BLAGN reported in Paul et al. (2024), and the filled triangles are the radio detected and RQ NLS1 reported in Berton et al. (2018). The light blue data point in the top left panel represents the stack of the X-ray selected but radio undetected AGN on the GOODS-N field performed by Radcliffe et al. (2021). The red diamond and the black data points in the bottom right panel, are computed considering log R = 1, while the red circle indicates the expected radio luminosity assuming log R = 0. The gray shaded areas represent the scatter of the relations, while the black dashed line is the 1:1 relation.
Current usage metrics show cumulative count of Article Views (full-text article views including HTML views, PDF and ePub downloads, according to the available data) and Abstracts Views on Vision4Press platform.
Data correspond to usage on the plateform after 2015. The current usage metrics is available 48-96 hours after online publication and is updated daily on week days.
Initial download of the metrics may take a while.